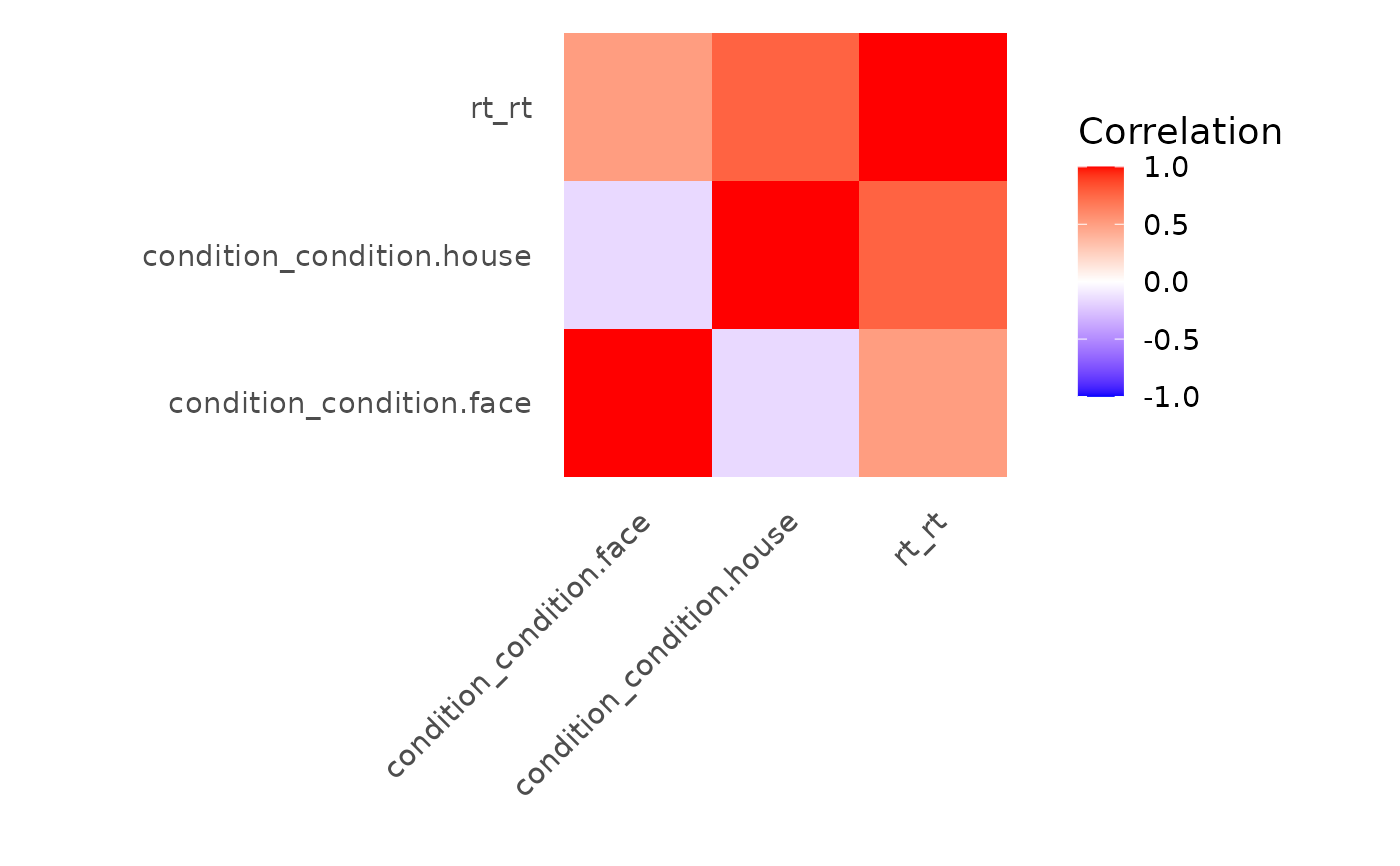
Generate a correlation heatmap showing the relationships between columns in a design matrix. This visualization helps identify potential collinearity between regressors in the model. For event models, it shows correlations between different conditions. For baseline models, it shows correlations between drift and nuisance terms.
These methods provide correlation heatmap visualizations for various model objects. They are thin wrappers around methods from fmridesign when appropriate.
Usage
correlation_map(x, ...)

# S3 method for class 'baseline_model'
correlation_map(
  x,
  method = c("pearson", "spearman"),
  half_matrix = FALSE,
  absolute_limits = TRUE,
  ...
)
Arguments
- x
The model object (event_model, baseline_model, or fmri_model)
- ...
Additional arguments passed to methods. Common arguments include:
methodCorrelation method: "pearson" (default) or "spearman"
half_matrixLogical; if TRUE, show only lower triangle (default: FALSE)
absolute_limitsLogical; if TRUE, set color limits to [-1,1] (default: TRUE)
- method
Correlation method: "pearson" (default) or "spearman"
- half_matrix
Logical; if TRUE, show only lower triangle (default: FALSE)
- absolute_limits
Logical; if TRUE, set color limits to [-1,1] (default: TRUE)
Value
A ggplot2 object containing the correlation heatmap, where:
Rows and columns represent model terms
Colors indicate correlation strength (-1 to 1)
Darker colors indicate stronger correlations
A ggplot2 object containing the correlation heatmap visualization
Examples
# Create event data
event_data <- data.frame(
  condition = factor(c("face", "house", "face", "house")),
  rt = c(0.8, 1.2, 0.9, 1.1),
  onsets = c(1, 10, 20, 30),
  run = c(1, 1, 1, 1)
)

# Create sampling frame
sframe <- sampling_frame(blocklens = 50, TR = 2)

# Create event model
evmodel <- event_model(
  onsets ~ hrf(condition) + hrf(rt),
  data = event_data,
  block = ~run,
  sampling_frame = sframe
)

# Plot correlation map for event model
correlation_map(evmodel)


# Create baseline model
bmodel <- baseline_model(
  basis = "bs",
  degree = 3,
  sframe = sframe
)

# Plot correlation map for baseline model
correlation_map(bmodel)


# Note: To create a full fmri_model and plot combined correlations,
# you would need an fmri_dataset object:
# fmodel <- fmri_model(evmodel, bmodel, dataset)
# correlation_map(fmodel, method = "pearson", half_matrix = TRUE)