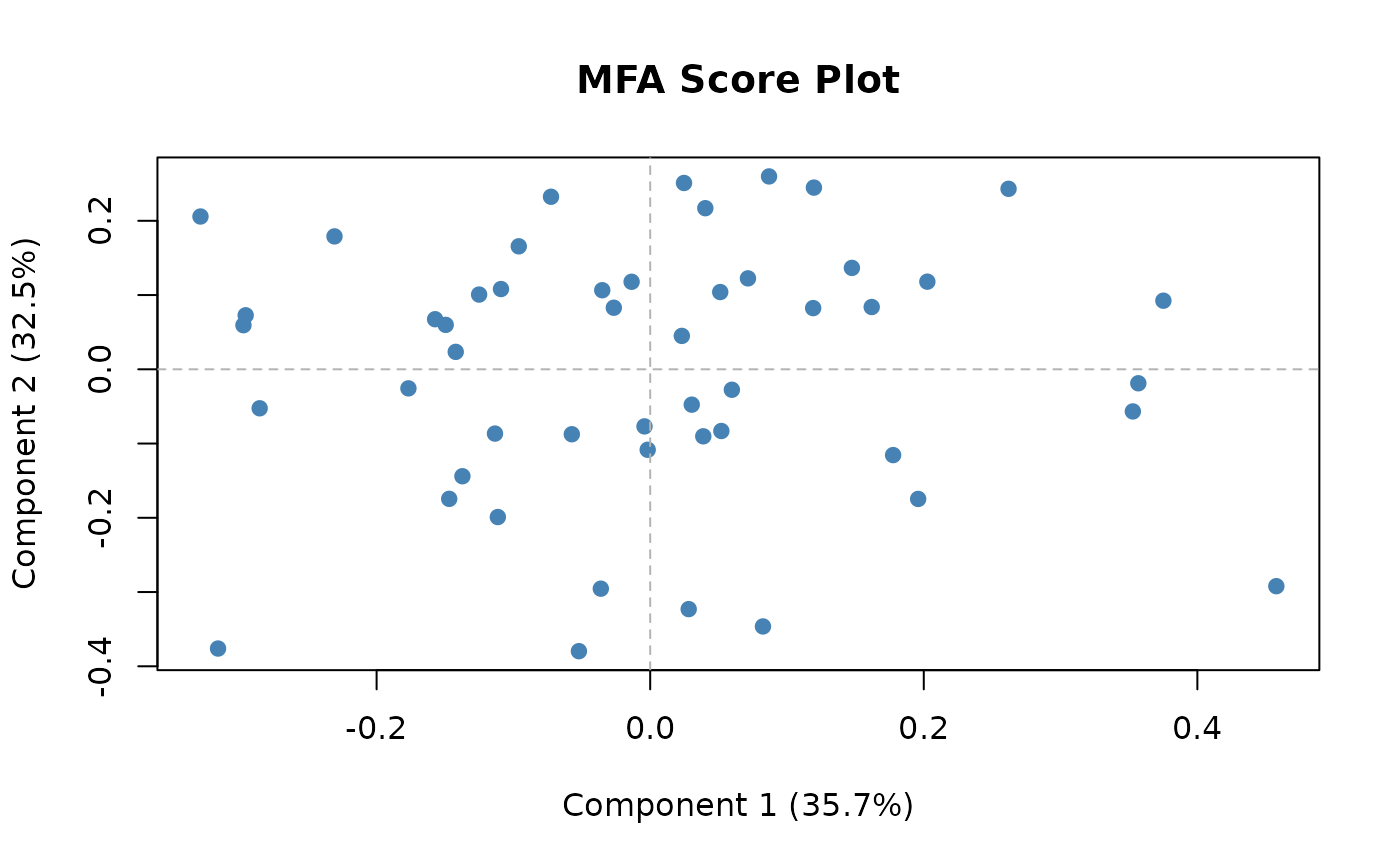
Displays observations in the MFA compromise space.
Usage
# S3 method for class 'mfa'
plot(
  x,
  dims = c(1, 2),
  labels = FALSE,
  col = NULL,
  pch = 19,
  cex = 1,
  main = "MFA Score Plot",
  ...
)
Arguments
- x
An object of class `mfa`.
- dims
Integer vector of length 2 specifying which components to plot.
- labels
Logical; if `TRUE`, label points with row names or indices.
- col
Point colors. If `NULL`, uses a default.
- pch
Point character.
- cex
Point size.
- main
Plot title.
- ...
Additional arguments passed to [plot()].
Value
Invisibly returns the score matrix (for the plotted dimensions).
Examples
# \donttest{
X <- replicate(3, matrix(rnorm(50 * 10), 50, 10), simplify = FALSE)
fit <- mfa(X, ncomp = 3)
#> Applying the same preprocessor definition independently to each block.
#> normalization type:MFA
plot(fit)

# }
# }