This vignette collects practical recipes for row and column metrics,
plus notes on SPD remedies and the experimental gpca_mle()
learner.
Why metrics
Metrics encode weighting and correlation. The row metric
M changes how observations are compared; the column metric
A changes how variables are compared. Setting either to
something other than the identity is how you tell the decomposition what
you already know about the data: that the samples are a time series,
that the variables sit on a spatial grid or fall into groups, that some
measurements are noisier than others. Ordinary PCA has no way to accept
that information and treats every row and column alike. GPCA writes it
into the objective being optimised.
Structure alone is not enough, though: you also have to get the direction right, and supplying a matrix versus its inverse produces opposite results. The next section is about that, and it is worth reading before the recipes.
Both metrics must also be symmetric and positive semi-definite. That
rarely gets in the way, but it does constrain what you can pass; see SPD requirements and remedies
below for what the requirement means and what genpca() does
when a metric falls short of it.
Heteroscedastic diagonals
The simplest non-trivial metric is a diagonal that down-weights noisy rows or columns:
set.seed(42)
n <- 60; p <- 20
X <- matrix(rnorm(n * p), n, p)

col_noise_sd <- runif(p, 0.5, 2)
A <- Diagonal(x = 1 / col_noise_sd^2)
row_noise_sd <- runif(n, 0.7, 1.3)
M <- Diagonal(x = 1 / row_noise_sd^2)

fit <- genpca(X, M = M, A = A, ncomp = 3,
              preproc = multivarious::center())
fit$sdev
#> [1] 14.69818 11.24551 10.96887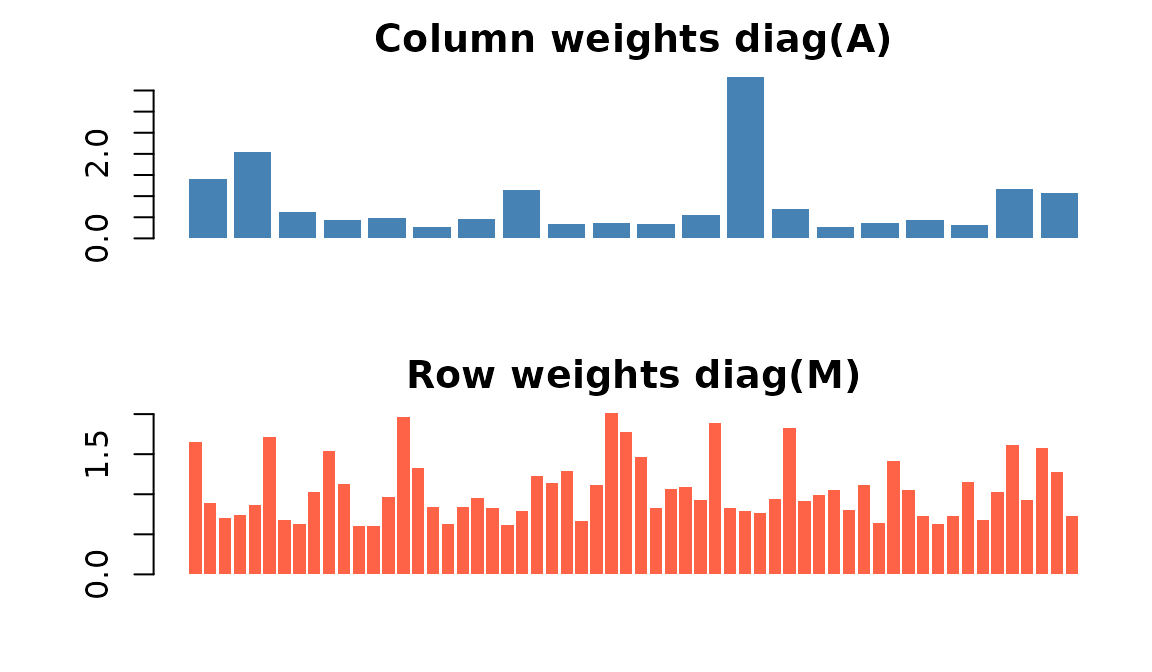
Inverse-variance weights on columns (top) and rows (bottom). Noisier dimensions get smaller weights.
Inverse column variance is scaled PCA
Inverse-variance weighting on the columns is not a new idea in
disguise: it is exactly the standardisation that
prcomp(scale. = TRUE) performs. GPCA whitens with the
square root
,
so setting
makes
— the column-scaled matrix that correlation-matrix PCA decomposes.
set.seed(42)
Xv <- matrix(rnorm(60 * 20), 60, 20) %*% diag(runif(20, 0.5, 3))
sds <- apply(Xv, 2, sd)

g  <- genpca(Xv, A = Diagonal(x = 1 / sds^2), ncomp = 5,
             preproc = multivarious::center())
pr <- prcomp(Xv, scale. = TRUE)

# scores agree component by component
sapply(1:3, function(k) cor(multivarious::scores(g)[, k], pr$x[, k]))
#> [1] -1 -1 -1
The scores are identical (up to sign). The reported sdev
values differ by a single constant, because prcomp()
divides its singular values by
and genpca() reports them unnormalised:
rbind(genpca = g$sdev[1:5],
      prcomp = pr$sdev[1:5],
      ratio  = g$sdev[1:5] / pr$sdev[1:5])
#>             [,1]      [,2]      [,3]     [,4]     [,5]
#> genpca 11.527935 10.943470 10.310907 9.651052 9.172200
#> prcomp  1.500809  1.424718  1.342366 1.256460 1.194119
#> ratio   7.681146  7.681146  7.681146 7.681146 7.681146
sqrt(nrow(Xv) - 1)
#> [1] 7.681146
The constant ratio is the whole difference. This is worth
internalising as the baseline: a diagonal A
generalises column scaling, and everything else in this
vignette — kernels, Laplacians, AR(1) structure — generalises it further
by letting the metric go off-diagonal.
Weighting both margins at once
The example above sets M and A
simultaneously, which is a reasonable thing to want when both
observations and variables are heteroscedastic. Two consequences are
easy to miss.
The two weightings interact. GPCA works with , so the row weights change each column’s effective variance and the column weights change each row’s. Estimating row and column standard deviations from the raw data and applying both at once therefore standardises neither margin:
Xc <- scale(Xv, center = TRUE, scale = FALSE)
W  <- diag(1 / apply(Xc, 1, sd)) %*% Xc %*% diag(1 / apply(Xc, 2, sd))

range(apply(W, 1, sd))   # row SDs, would be constant if standardised
#> [1] 0.4075883 0.6182529
range(apply(W, 2, sd))   # column SDs
#> [1] 0.4740343 0.5317369
Each rescaling changes the other margin’s standard deviations, so one
pass does not produce unit variance on both. Alternating marginal
scaling is a separate procedure from gpca_mle(): that
learner alternates a low-rank fit with estimates of the full residual
row and column covariances, including a ridge penalty. It does not
simply standardize the two margins.
Only the product of the two scales is identified. Replacing with leaves untouched, so the fit cannot distinguish them:
M0 <- Diagonal(x = 1 / apply(Xv, 1, sd)^2)
A0 <- Diagonal(x = 1 / sds^2)

f1 <- genpca(Xv, M = M0,     A = A0,     ncomp = 4, preproc = multivarious::center())
f2 <- genpca(Xv, M = 7 * M0, A = A0 / 7, ncomp = 4, preproc = multivarious::center())

max(abs(f1$sdev - f2$sdev))
#> [1] 8.881784e-16
The singular values and the component subspace are identical; only
the scores pick up a constant factor, since their normalisation is tied
to the scale of M. The practical upshot is that there is no
point tuning the overall magnitude of M against that of
A — it is the relative weighting within each
metric that changes the answer. This indeterminacy is also why
gpca_mle() has a scale_fix argument: when both
metrics are learned, the split is pinned down by the ridge penalty in
the objective (the default, scale_fix = "none"), and
"trace"/"det" are optional post-hoc
reparameterizations whose effect on the penalized objective is reported
in loglik_rescale_delta.
Which way does a metric point?
Before the recipes, the single most important thing to get right — and the easiest to get backwards. A metric amplifies its own dominant eigendirections.
Seeing why means being precise about what comes back from a fit. GPCA
factorises
,
where
is orthonormal in the column metric rather than in the ordinary
sense:
.
The loadings returned by components(fit) are not
but
:
set.seed(1)
Xd <- matrix(rnorm(400), 40, 10)
Ad <- crossprod(matrix(rnorm(100), 10, 10)) / 10 + diag(10)
fd <- genpca(Xd, A = Ad, ncomp = 3, preproc = multivarious::center())

max(abs(multivarious::components(fd) - as.matrix(Ad %*% fd$ov)))
#> [1] 0
Multiplication by
changes how the fitted factor is expressed. It stretches every direction
in proportion to the eigenvalue
assigns it, so the patterns
scores highly are the patterns that dominate the loadings you read off.
(The bare factor
is kept in the ov slot if you ever need it, but
components() is what you should normally interpret.)
For a spatial or temporal structure there are two natural matrices, and they point in opposite directions:
| You supply | measures | Large eigenvalues on | Components come out |
|---|---|---|---|
| A smoother: kernel , adjacency , , heat kernel | agreement between neighbours | smooth patterns | smoother |
| A precision: Laplacian , , , inverse AR(1) | disagreement across edges (Dirichlet energy ) | rough patterns | rougher |
Both are legitimate, because they encode different beliefs about where the noise lives. The bridge is , and the step that is easy to skip is the inversion: the metric and the noise covariance share eigenvectors but carry reciprocal weights, so a direction the metric scores highly is a direction the noise model calls quiet.
That reciprocal is worth seeing rather than taking on faith. On a cycle graph the Laplacian and the adjacency share Fourier eigenvectors exactly, so “roughness” is unambiguously frequency:
p <- 32
Wc <- matrix(0, p, p)
for (i in 1:p) { Wc[i, i %% p + 1] <- 1; Wc[i %% p + 1, i] <- 1 }
Lc <- diag(rowSums(Wc)) - Wc

ec <- eigen(Lc, symmetric = TRUE)
o  <- order(ec$values)
Vc <- ec$vectors[, o]          # smoothest first
lc <- ec$values[o]             # Dirichlet energy = roughness

Ac  <- diag(p) + 0.45 * Wc     # a smoother (PSD)
Sig <- solve(Ac)               # the noise covariance it implies

modes <- c(1, 16, 32)          # smoothest, middling, roughest
data.frame(
  roughness   = round(lc[modes], 3),
  metric_wt   = round(sapply(modes, function(k) t(Vc[, k]) %*% Ac  %*% Vc[, k]), 3),
  noise_var   = round(sapply(modes, function(k) t(Vc[, k]) %*% Sig %*% Vc[, k]), 3)
)
#>   roughness metric_wt noise_var
#> 1         0       1.9     0.526
#> 2         2       1.0     1.000
#> 3         4       0.1    10.000
The metric weight falls with roughness while the implied noise variance rises, each the reciprocal of the other. Note this is a statement about , not about the adjacency matrix you supplied: itself has its large eigenvalues on the smooth directions. Inverting is what moves the variance to the rough end.
- Smoother as metric is large on smooth directions is large on the rough ones “the noise is high-frequency speckle; the signal is smooth.” This is denoising, and it is what you want when you are after spatially coherent maps.
- Precision as metric is large on rough directions is large on the smooth ones “a smooth field — drift, a scanner gradient, a global trend — is the nuisance.” Whitening it away lets fine-scale structure surface. This is ordinary generalized least squares against correlated noise.
One caveat on how literally to read this.
is an interpretive frame, not a constraint genpca()
enforces — the algorithm only ever whitens with
.
The covariance reading is how you should choose a metric, and
it is what makes “smoother
denoising” more than a slogan.
So the question is never “adjacency or Laplacian?” in the abstract. It is: is the smooth thing my signal, or my nuisance?
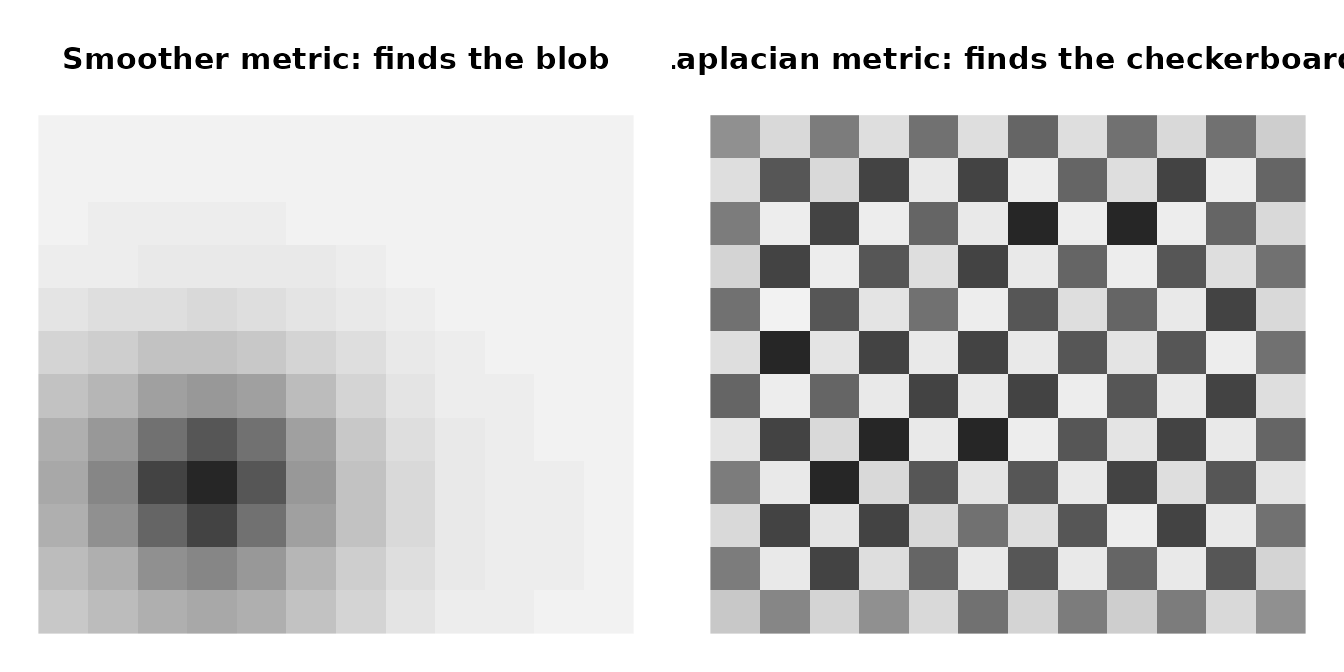
The same graph, two metrics. Left: a smoother concentrates PC1 on the smooth blob. Right: the Laplacian whitens the smooth field away, so PC1 locks onto the fine-scale checkerboard that was buried underneath it.
Two practical notes on the graph matrices themselves. A raw adjacency
is indefinite (its eigenvalues sum to zero), so it is
not a valid metric on its own — shift it, as in
with
small enough to keep it PSD. A raw Laplacian
is PSD but singular:
,
so the spatially constant pattern has zero length under it.
genpca() accepts that (the whitening uses a
pseudo-inverse), but adding a small ridge,
,
is usually what you want.
The example compares a smoother with coefficient 2 against a precision with coefficient 50. It demonstrates these two choices, not a universal switching threshold. Sweep the strength on your own data and inspect the loadings.
Recipes
Each recipe below is labelled with the direction it produces. All
three are written as precision matrices. For the AR(1)
and RBF recipes, use the covariance inside solve() to
obtain the smoother orientation. The Laplacian recipe constructs a
precision directly; invert its regularized matrix to obtain a
smoother.
AR(1) row metric (whitens temporal autocorrelation)
Standard GLS treatment of serially correlated observations, as in fMRI prewhitening: it removes temporal autocorrelation rather than imposing temporal smoothness.
Graph Laplacian (emphasises contrast across edges)
W <- bandSparse(30, k = c(-1, 0, 1),
                diagonals = list(rep(0.2, 29),
                                 rep(1, 30),
                                 rep(0.2, 29)))
D     <- Diagonal(x = rowSums(W))
A_lap <- (D - W) + 1e-2 * Diagonal(nrow(W))
# A_smooth <- solve(A_lap)                  # smoother: spatially coherent loadings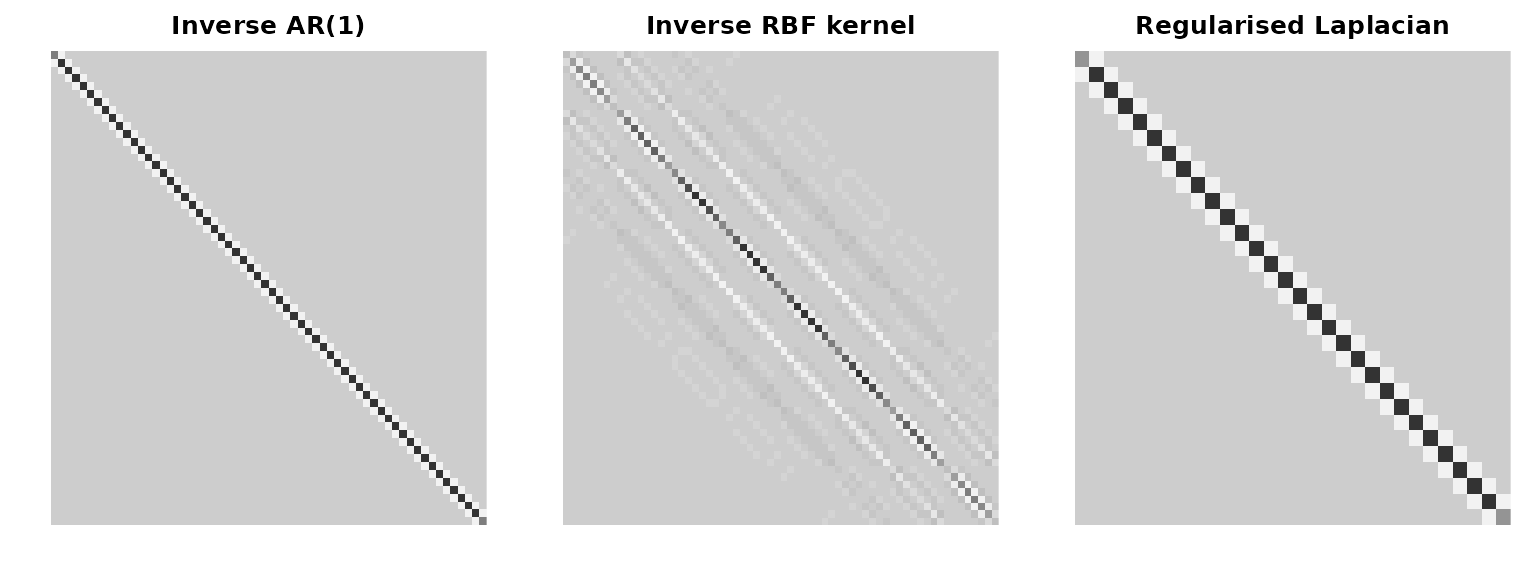
Three structured metrics, all shown in the precision (noise-whitening) orientation. Off-diagonal banding is what couples nearby rows or variables – it tells GPCA ‘treat these dimensions as related, not independent’.
A note on sfpca()
sfpca() takes the opposite input for the same
intent. There the structure enters as a constraint,
,
which charges rough
against a fixed budget — so the spatial roughness operator is built from
spat_cds, and alpha_v controls its strength.
Larger alpha_v means smoother; it is a
scalar, not an argument for supplying a matrix. Metric form and
constraint form are inverse to one another: the same Laplacian smooths
in sfpca() and roughens in genpca().
Learning metrics with gpca_mle()
gpca_mle() is an experimental learner that alternates a
low-rank fit with regularized matrix-normal covariance estimates. Use it
to explore estimated metrics, checking their spectra and sensitivity to
the ridge parameter lambda. An i.i.d. input does not
guarantee an identity-like fitted metric: a single small data matrix
provides limited information about unrestricted row and column
covariances, especially after fitting a low-rank mean.
set.seed(1)
n_m <- 40; p_m <- 10
X_mle <- matrix(rnorm(n_m * p_m), n_m, p_m)
fit_mle <- gpca_mle(X_mle, ncomp = 2, max_iter = 6,
                    lambda = 1e-3, scale_fix = "none",
                    method = "eigen", verbose = FALSE)

metric_spectrum <- function(W) {
  ev <- eigen(as.matrix(W), symmetric = TRUE, only.values = TRUE)$values
  c(min = min(ev), max = max(ev), condition = max(ev) / min(ev))
}
signif(rbind(M = metric_spectrum(fit_mle$M),
             A = metric_spectrum(fit_mle$A)), 3)
#>        min  max condition
#> M 4.27e-04 1000  2.34e+06
#> A 6.34e+02 1000  1.58e+00
The row metric has widely separated eigenvalues. A heatmap can look nearly diagonal while hiding this distinction, so plot the spectrum after removing overall scale. An identity-like metric would have every normalized eigenvalue near one.
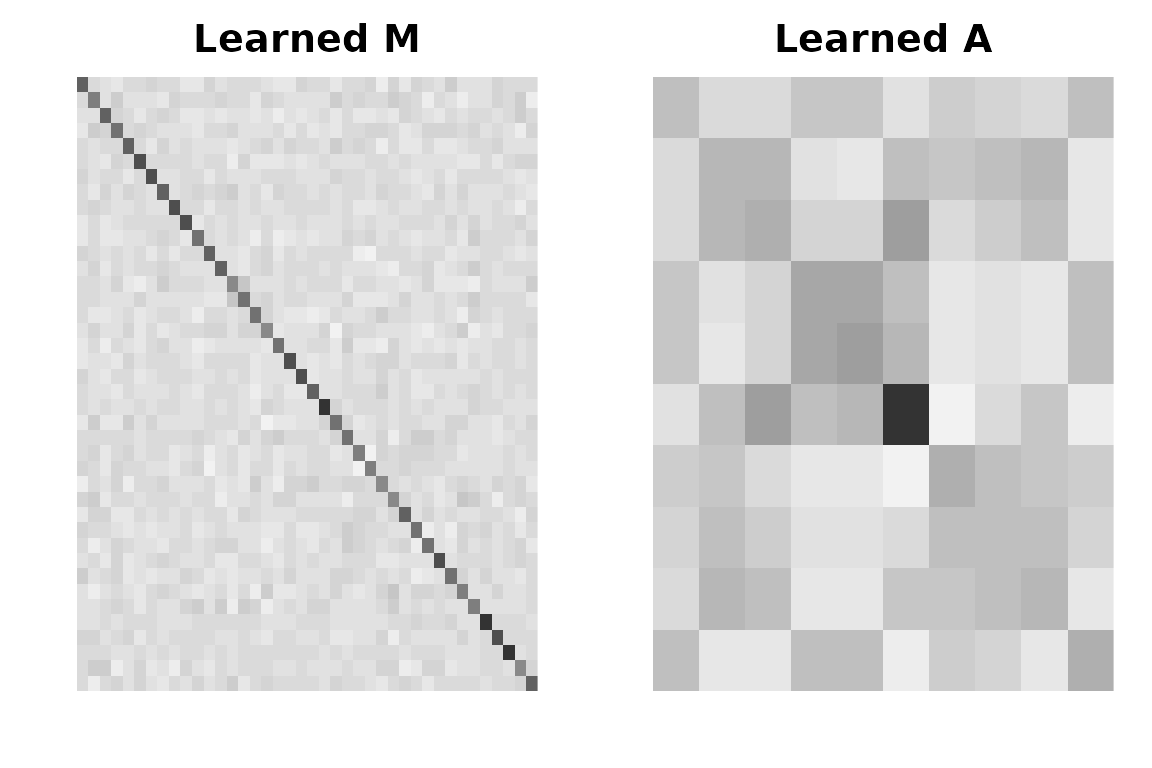
Metric eigenvalues divided by their mean, on a log scale. The dashed line marks an identity-like spectrum; the learned row metric departs strongly from it.
Inspect optimization progress as well:
data.frame(iteration = seq_along(fit_mle$loglik_path),
           penalized_loglik = fit_mle$loglik_path)
#>   iteration penalized_loglik
#> 1         1         1204.753
#> 2         2         1368.764
#> 3         3         1526.016
#> 4         4         1660.870
#> 5         5         1744.850
#> 6         6         1773.051
Six iterations are an illustration, not evidence of convergence or
covariance recovery. Keep lambda positive and compare
results across its plausible values. The default
scale_fix = "none" retains the scale selected by the
penalized fit; optional "trace" or "det"
rescaling changes the penalized objective, reported in
loglik_rescale_delta. The separate
loglik_refit_delta records the remaining difference between
the last iteration’s objective and the returned objective, including the
final refit and numerical reevaluation. With
scale_fix = "none", the rescale delta is exactly zero even
when the refit delta is nonzero.
SPD requirements and remedies
Why the requirement exists
GPCA measures squared lengths using and , and the solvers whiten the data with the square roots and . Both steps need the metrics to be symmetric positive semi-definite (PSD). If a metric has a negative eigenvalue, vectors in that direction have negative squared length, the square root is not real, and “maximise variance” no longer picks out anything meaningful.
Note that semi-definite is enough. Singular metrics
are perfectly legal. A graph Laplacian is rank-deficient by
construction — it has a zero eigenvalue on the constant vector — and
genpca() takes it without complaint. A zero eigenvalue
simply means that direction is given no weight. Only negative
eigenvalues are a problem.
What happens when a metric falls short
Distinguish singularity from invalidity: a sample covariance from
fewer samples than variables can be singular and still PSD. Rounding can
produce small negative eigenvalues or slight asymmetry; an incorrectly
constructed metric can produce larger violations. The checks are
relative to the scale of the matrix, with a tolerance for floating-point
noise: eigenvalues down to
(about
times the largest diagonal entry) count as non-negative, and an
asymmetry
below
is averaged away. Tiny asymmetry may therefore be averaged away; metric
factorization also uses numerical tolerances to identify null
directions. An explicit "clip" request removes negative
eigenvalues even if they pass the tolerant PSD check.
A genuinely asymmetric matrix is an error under every setting: there
is no way to know which triangle you meant. And a metric that fails the
PSD check is an error by default
(constraints_remedy = "error"), because a fit that silently
ran on a different metric than the one you supplied is worse than no
fit. If you do want a repair, ask for it, and you will be told what was
done:
| Value | What it does | What it costs |
|---|---|---|
"error" (default) |
Refuses the input. | Nothing — this is the right setting when the metric comes from a pipeline that ought to be producing a valid one. |
"ridge" |
Adds a diagonal shift (from the Gershgorin bound, with a
Matrix::nearPD() fallback for small dense matrices)
sufficient to make the matrix positive definite. Preserves
sparsity. |
The shift pulls the metric toward a multiple of the identity, diluting the structure you supplied. A large shift means the input was badly indefinite — diagnose it rather than absorb it. |
"clip" |
Eigendecomposes and sets the negative eigenvalues to zero, leaving the rest of the spectrum exactly as it was. | Densifies the matrix, so it refuses sparse input larger than
2000×2000. Use "ridge" at that size. |
"identity" |
Replaces the offending metric with the identity. | Discards the offending metric; the other metric still applies. |
Every repair that actually changes the metric emits a warning of
class genpca_metric_repaired whose report
field records the minimum eigenvalue before and after, the shift
applied, the rank and the condition number. The same report is available
directly from repair_metric(), which is the better way to
work: repair once, look at the report, and pass the repaired matrix to
every subsequent fit.
# Is the metric usable as-is, and what would a repair do to it?
A_ok <- repair_metric(A, method = "ridge")
attr(A_ok, "repair_report")

# Catch the repair warning programmatically inside a fit
fit <- withCallingHandlers(
  genpca(X, A = A, M = M, ncomp = 3, constraints_remedy = "ridge"),
  genpca_metric_repaired = function(w) { print(w$report); invokeRestart("muffleWarning") }
)
Prefer metrics that are PSD by construction, such as a PSD kernel, a graph Laplacian, or a nonnegative diagonal. Dividing a metric by its mean diagonal changes its overall magnitude but leaves its condition number unchanged. Inspect the repair report when a repair is requested, and inspect learned metric spectra even when no warning is emitted.
Where next
See Modelling Structured Noise for how to choose the transfer function when several kinds of structure are present at once, and GPCA at Scale for backend choices, sparse workflows, and covariance-only GPCA.