Fit a weighted analysis
genpca() takes a numeric matrix with
observations in rows and variables in columns. A row
metric M weights observations; a column metric
A weights variables. With identity metrics and the same
preprocessing, it recovers ordinary PCA.
Start with the three crime variables in USArrests: 50
states by 3 variables. Their spreads differ substantially. Set
A to inverse column variances so that Assault does not
dominate simply because of its numerical scale. This is equivalent to
PCA on standardized columns.
data("USArrests")
X <- as.matrix(USArrests[, c("Murder", "Assault", "Rape")])
col_sd <- apply(X, 2, sd)
A <- Diagonal(x = 1 / col_sd^2)
fit <- genpca(X, A = A, ncomp = 2,
              preproc = multivarious::center())

S <- multivarious::scores(fit)       # 50 states x 2 components
V <- multivarious::components(fit)   # 3 variables x 2 projection weights
round(cor(X, S), 2)
#>           PC1   PC2
#> Murder  -0.89  0.36
#> Assault -0.93  0.14
#> Rape    -0.83 -0.55
The variable-score correlations give the axes an interpretation. PC1 moves with all three crime variables; PC2 contrasts Murder with Rape more strongly than it contrasts Assault with Rape. Component signs are arbitrary: reversing an axis leaves the analysis unchanged.
States in the two-component space after inverse-variance weighting of the crime variables. Six states with extreme scores are labelled.
To see the effect of scaling, compare each variable’s correlation with PC1 under the two fits. Absolute correlations remove the arbitrary axis sign.
fit_raw <- genpca(X, ncomp = 2, preproc = multivarious::center())
round(cbind(
  unscaled = abs(cor(X, multivarious::scores(fit_raw)[, 1])),
  scaled   = abs(cor(X, S[, 1]))
), 2)
#>         [,1] [,2]
#> Murder  0.80 0.89
#> Assault 1.00 0.93
#> Rape    0.67 0.83
Use the fitted object
The result is a bi_projector. Use its public accessors
to inspect the fit, reconstruct the input, or project new rows with the
training preprocessing.
Xhat <- multivarious::reconstruct(fit)   # 50 x 3, back in original units
scores_again <- multivarious::project(fit, X)
max(abs(S - scores_again))              # numerical zero on training rows
#> [1] 8.881784e-16| Operation | Output |
|---|---|
multivarious::scores(fit) |
n x k training coordinates |
multivarious::components(fit) |
p x k projection weights |
multivarious::project(fit, X_new) |
n_new x k coordinates, with training
centering applied |
multivarious::reconstruct(fit, comp = 1:k) |
n x p reconstruction, with centering
reversed |
New data must have the same variables in the same order. Centering is
fitted on the training data; do not center a new batch separately before
project().
Add observation weights
A diagonal M changes how much each row contributes to
the objective. As an illustration, give greater weight to states with a
higher urban population percentage. This is an analytical choice, not a
claim that those states are more reliable or a weighting by total
population.
urban_wt <- USArrests$UrbanPop / mean(USArrests$UrbanPop)
M <- Diagonal(x = urban_wt)
fit_row <- genpca(X, M = M, A = A, ncomp = 2,
                  preproc = multivarious::center())
round(cor(X, multivarious::scores(fit_row)), 2)
#>           PC1   PC2
#> Murder  -0.89 -0.42
#> Assault -0.93 -0.22
#> Rape    -0.84  0.49
The weights change the fitted axes; they do not push a state toward a
particular signed end of an axis. This fit retains ordinary column
centering through multivarious::center(); setting
M does not change that preprocessing into weighted
centering.
Choose the number of components
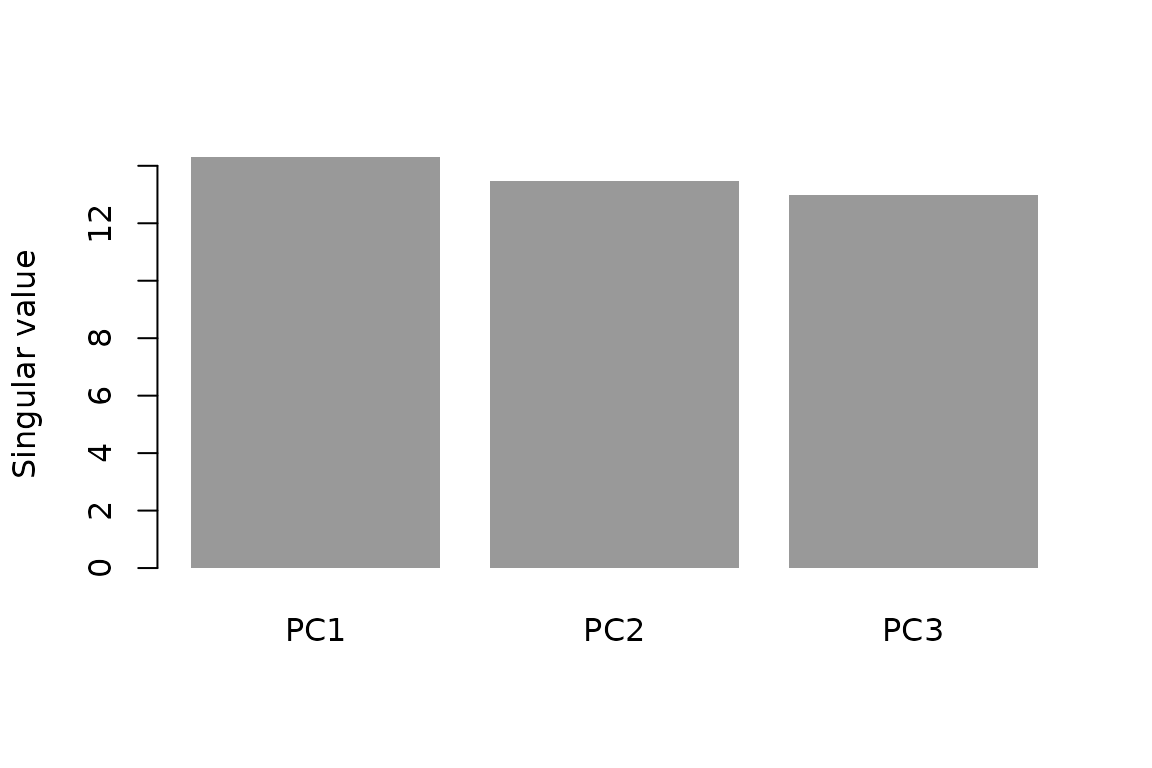
fit$sdev contains singular values of the metric-whitened
data. With identity metrics and centering, these equal
prcomp(X)$sdev * sqrt(nrow(X) - 1). Fit the full available
spectrum before using a scree plot to choose a rank:
fit_all <- genpca(X, A = A, ncomp = ncol(X),
                  preproc = multivarious::center())
share <- fit_all$sdev^2 / sum(fit_all$sdev^2)
barplot(share, names.arg = paste0("PC", seq_along(share)),
        ylim = c(0, 1), ylab = "Fraction of weighted variation",
        col = "grey60", border = NA)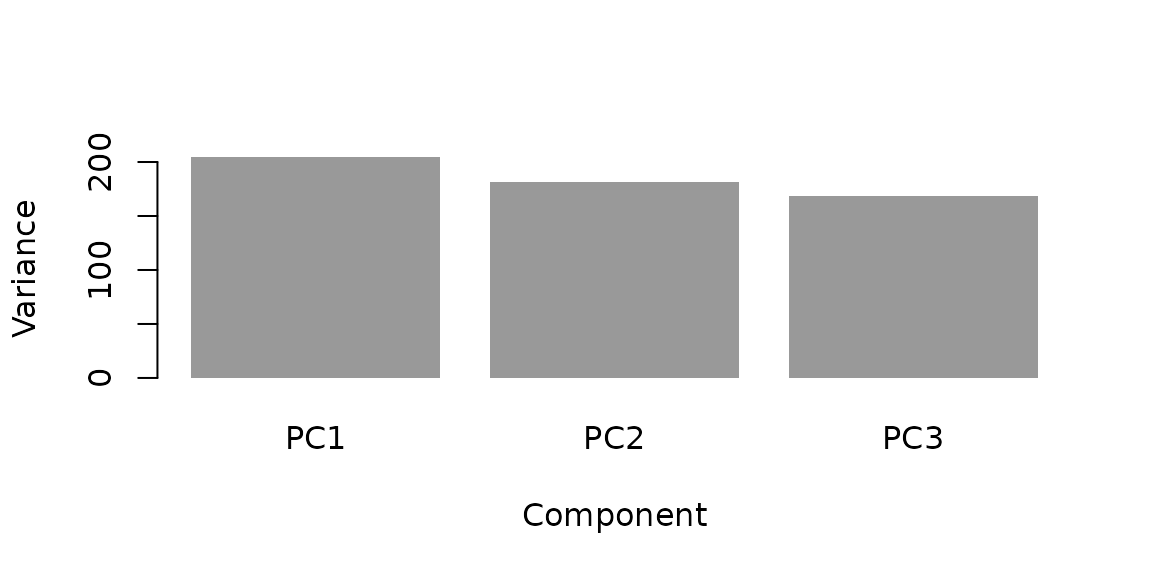
Fraction of total weighted variation for all three available components.
The first two components account for 93.9% of the weighted variation in this example. A scree plot describes the training fit; it does not establish how well components will generalize. For prediction, compare held-out reconstruction error using preprocessing and data-derived metrics estimated on training rows only.
Where next
- GPCA Metrics: construct row and column metrics and choose between smoothing and noise whitening.
- Modelling Structured Noise: explore those choices with known signal and noise in simulations.
- GPCA at Scale: choose a backend, budget memory, and project held-out observations.
- Sparse and Functional PCA: fit sparse, smooth factors.
- Generalized PLS-SVD: relate two data blocks, with an explicit whitening reference for contributors.
The remaining sections explain the mathematics and notation behind the fit.
The decomposition
Two metrics, one weighted objective
Let be the data matrix. Generalized PCA asks you to supply two symmetric positive semi-definite matrices:
- (), the row metric, which puts a geometry on the space of observations;
- (), the column metric, which puts a geometry on the space of variables.
For positive definite metrics, they define an inner product on matrices,
When and this is the ordinary Frobenius inner product, and the decomposition reduces to the familiar SVD and PCA. Singular PSD metrics instead define a seminorm: directions in their null spaces have zero weight. Here denotes the preprocessed data, after centering if requested.
The problem it solves
The generalized least-squares matrix decomposition (GMD) of Allen, Grosenick & Taylor (2014) is the best rank- approximation of in that norm:
with .
Only two things changed relative to the SVD, and they are the same change twice: the discrepancy is measured in the norm rather than the Frobenius norm, and the factors are orthonormal in the metrics rather than Euclidean-orthonormal.
The solution: whiten, decompose, unwhiten
The problem has a closed form. Take symmetric square roots and , whiten the data,
and compute its ordinary SVD, . Then
solves the problem above (with pseudo-inverses when a metric is singular). GMD is therefore an SVD in the coordinates selected by the metrics.
For positive definite metrics, eliminating the whitening gives the eigenproblem
and the -th generalized principal component (the score vector) is
For singular metrics, the pseudo-inverse factors solve the problem on the metrics’ supported subspaces; the identities above need the corresponding projections when interpreted outside those subspaces.
In the package these are components(fit)
ov
for the loadings and scores(fit)
ou %*% diag(sdev) for the scores, with ou and
ov holding the metric-orthonormal factors
and
.
What the metrics mean
There are two readings of and , and both are worth carrying.
As geometry. The metrics define what “distance” means, and they act crosswise. Observations are rows of , living in , so the column metric sets the distance between two observations, . Variables are columns, living in , so the row metric sets the distance between two variables — and, when is diagonal, simply weights the observations. Choose to say which variables should be treated as similar; choose to say which observations count more.
As statistics. Suppose the noise is separable, meaning the errors follow a matrix-normal law , equivalently has covariance . Then the log-likelihood of a rank- mean is, up to constants, exactly with
So the metrics are not an arbitrary regularizer: setting them to the
inverse noise covariances makes GMD the maximum-likelihood low-rank fit.
This is why the package ships gpca_mle(), which learns
by penalized maximum likelihood, and mnpca_mrl(), which
does the same with sparse precision matrices.
Choosing structured metrics
Use GPCA Metrics: Building M and A for runnable recipes. The direction of the weighting matters:
- To favour smooth column loadings, start with a PSD kernel or a smoother such as , where is a graph Laplacian. A raw adjacency or distance matrix need not be PSD and cannot be used without a valid metric construction.
- To account for correlated noise, use its inverse covariance. For a time-by-voxel table with separable Gaussian noise, choose and . The row metric acts on time and the column metric on space. A covariance model for related samples likewise enters through its inverse when the goal is noise whitening.
-
sfpca()encourages smooth, sparse factors through a different constraint. Its spatial penalty is built fromspat_cds; increasingalpha_vstrengthens that penalty. See Sparse and Functional PCA before transferring tuning choices between the two interfaces.
A Laplacian as A emphasizes contrasts across graph
edges; its inverse (with a ridge to make it invertible) emphasizes
smooth directions. Select between these according to whether smooth
variation is signal or nuisance.
Choosing a backend
The default method = "eigen" uses a Gram eigenproblem on
the smaller side of the data. "spectra" usually applies
eigencore’s partial SVD to a whitened operator, with a dense fallback
and a small-side Gram route for a singular large-side metric.
"randomized" approximates a leading subspace;
"deflation" extracts components one at a time and can
preserve sparse data.
Neither "spectra" nor "randomized"
preserves sparse X: both make a dense data copy. Metric
factorizations and fallback storage also matter. GPCA at Scale describes those costs, the
maxeig guard, and the covariance-only interface.
What are ou, ov, u, and
v?
Under the hood, genpca() stores the raw factors of the
decomposition alongside the verbs above. ou and
ov are the metric-orthonormal factors of the paper (Allen,
Grosenick & Taylor 2014): ou is orthonormal in the row
metric (t(ou) %*% M %*% ou is the identity) and
ov is orthonormal in the column metric
(t(ov) %*% A %*% ov is the identity). u and
v are the same factors after applying the metric
(u = M %*% ou, v = A %*% ov), which is the
form used for components(). The table below ties these to
the verbs:
| Quantity | Definition | Relation to verbs |
|---|---|---|
ou |
Row-metric-orthonormal left factor | t(ou) %*% M %*% ou = I |
ov |
Column-metric-orthonormal right factor | t(ov) %*% A %*% ov = I |
v (components(fit)) |
A %*% ov |
Loadings in the original variable space |
s (scores(fit)) |
ou %*% diag(sdev) |
Stored training scores |
Here the decomposition applies to the preprocessed matrix
Xp, not raw X. For positive definite metrics,
the score formula is Xp %*% A %*% ov.
project() applies the stored preprocessing before
multiplying by the projection weights. With singular metrics, null-space
representatives can make projected coordinates differ from the stored
factor scores outside the weighted subspace.
Relation to the French school
Readers coming from analyse des données will recognize all
of this. The French tradition — Benzécri’s correspondence analysis,
formalized by Escoufier as the duality diagram —
describes an analysis by a triplet
:
a data table, a metric on the variable space, and a set of row masses.
The analysis is then the eigendecomposition of the operator
.
That is, term for term, the eigenproblem in The decomposition. Correspondence
analysis, multiple correspondence analysis, principal coordinates,
discriminant analysis, canonical correlation, and PLS are all recovered
by choosing the triplet appropriately; the ade4 package is
built directly on this formalism, and Abdi’s papers on the generalized
SVD — cited in this package’s DESCRIPTION — are the same
construction in English.
Watch the notation: means opposite things in the two literatures.
| Role | genpca |
Allen et al. (2014) | Duality diagram |
|---|---|---|---|
| Row metric / observation weights | M |
||
| Column metric / variable geometry | A |
What Allen, Grosenick & Taylor contribute on top of the classical
theory is less the geometry than the framing and the machinery: the
decomposition is posed as a best
rank-
approximation with an optimality theorem rather than only an
eigenanalysis; the metrics are allowed to be large, dense, and
structured (spatial kernels, temporal covariances) instead of the
diagonal weights typical of the classical treatments; and the
formulation extends cleanly to regularized and sparse variants, which is
what sfpca() implements.
References
Allen, G. I., Grosenick, L., & Taylor, J. (2014). A generalized least-square matrix decomposition. Journal of the American Statistical Association, 109(505), 145–159.
Escoufier, Y. (1987). The duality diagram: a means for better practical applications. In Development in Numerical Ecology. Springer.
Holmes, S. (2008). Multivariate data analysis: the French way. In Probability and Statistics: Essays in Honor of David A. Freedman. IMS.
Dray, S., & Dufour, A.-B. (2007). The ade4 package: implementing the duality diagram for ecologists. Journal of Statistical Software, 22(4).
Silverman, B. W. (1996). Smoothed functional principal components analysis by choice of norm. The Annals of Statistics, 24(1), 1–24.