Plot Eye Density
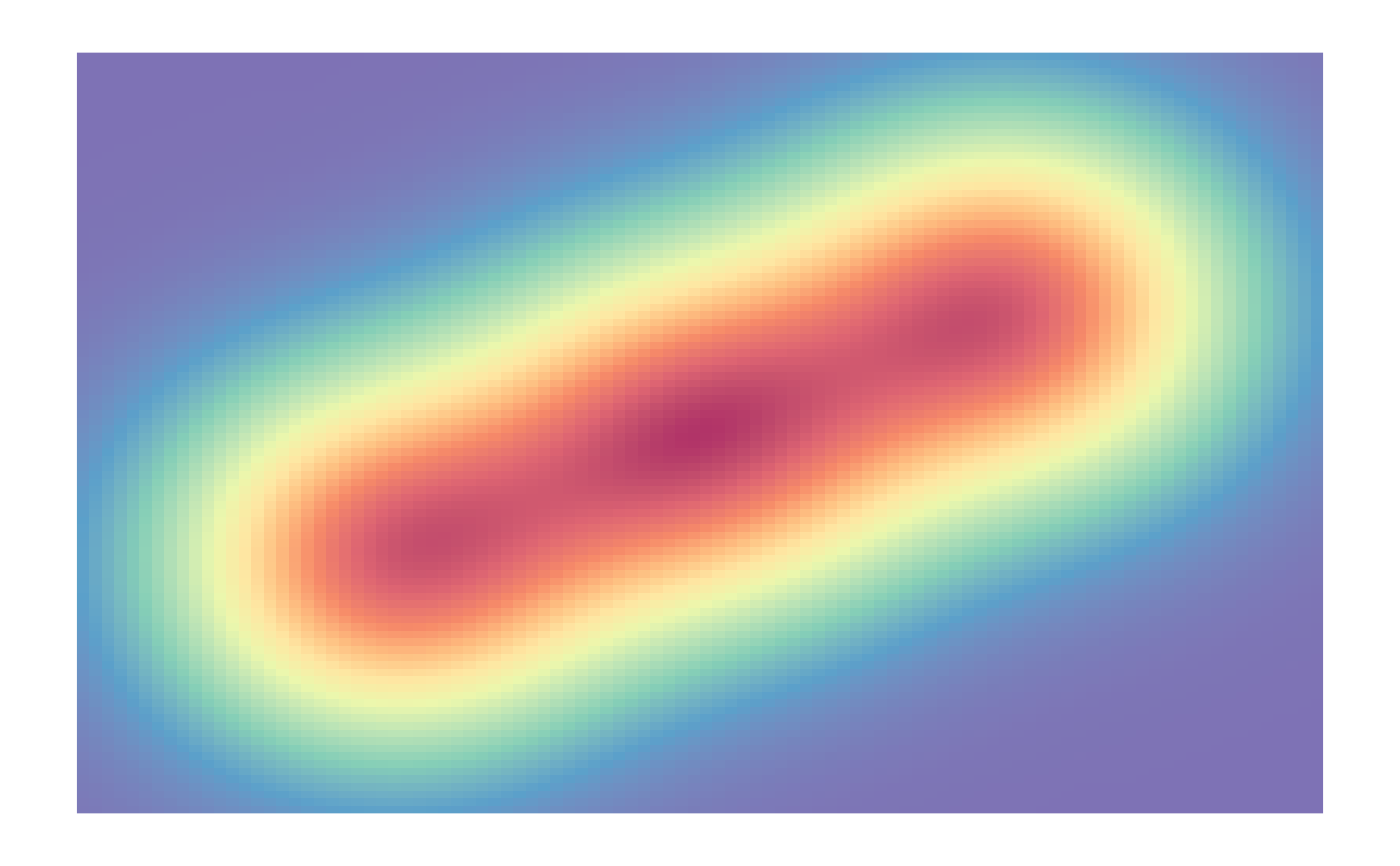
plot.eye_density.RdThis function creates a plot of the eye density using ggplot2.
See also
Other visualization:
anim_scanpath(),
plot.fixation_group()
Examples
# Create a fixation group and compute eye density
fg <- fixation_group(x = c(100, 200, 300), y = c(100, 150, 200),
                     onset = c(0, 200, 400), duration = c(200, 200, 200))
ed <- eye_density(fg, sigma = 50, xbounds = c(0, 400), ybounds = c(0, 300))
# Plot the eye density
plot(ed)