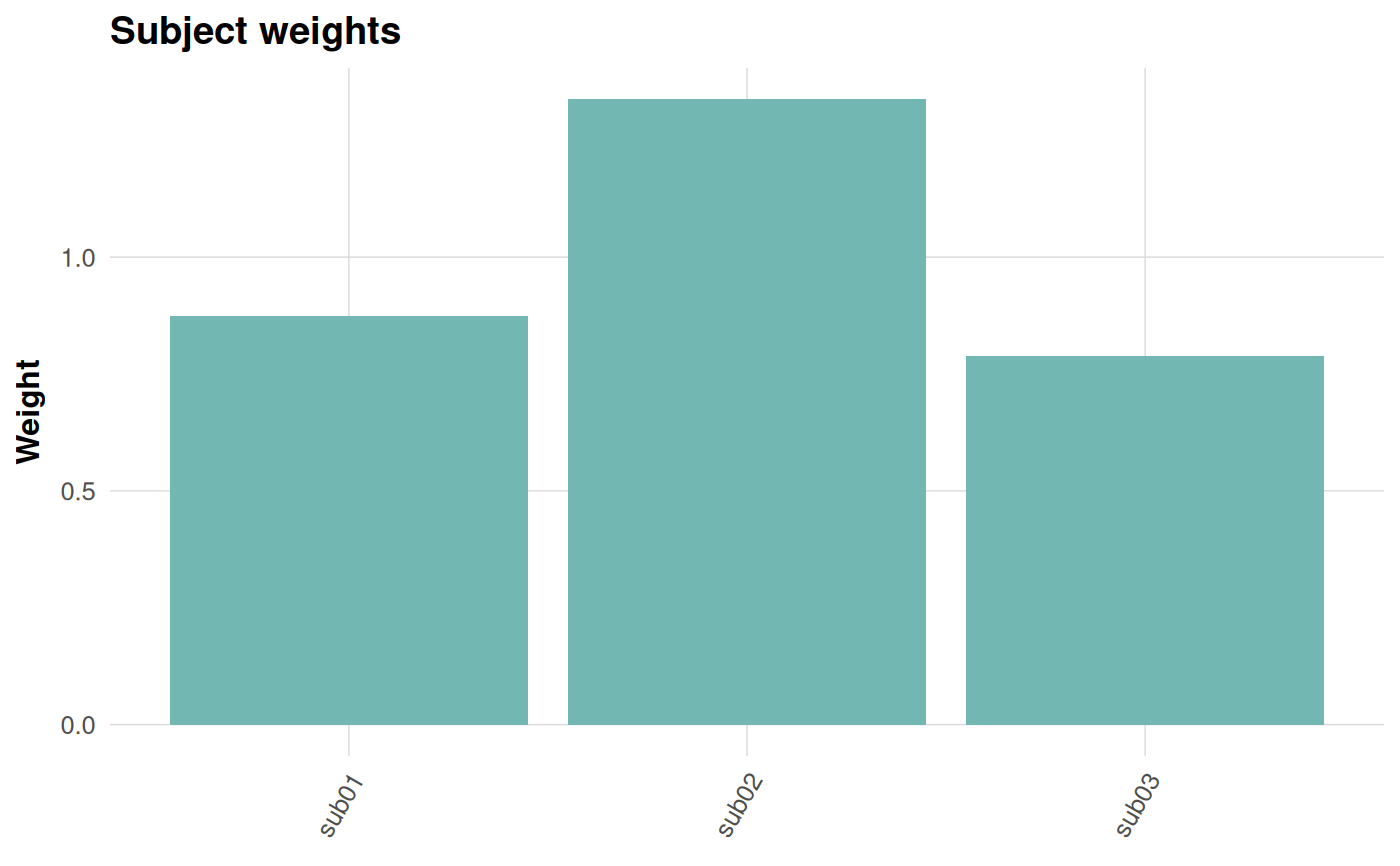
Subject weights and per-component energy heatmap
Examples
toy <- dkge_sim_toy(
  factors = list(A = list(L = 2), B = list(L = 3)),
  active_terms = c("A", "B"), S = 3, P = 15, snr = 5
)
fit <- dkge(toy$B_list, toy$X_list, kernel = toy$K, rank = 2)
#> Warning: Argument 'kernel' is deprecated; use 'K' instead.
panels <- dkge_plot_subject_contrib(fit, comps = 1:2)
panels$weights