Anchor-level information plots
Usage
dkge_plot_info_anchor(info_haufe = NULL, info_loco = NULL, top = 20)
Arguments
- info_haufe
Result from `dkge_info_map_haufe()`.
- info_loco
Result from `dkge_info_map_loco()`.
- top
Number of anchors to annotate.
Value
List of ggplot objects.
Examples
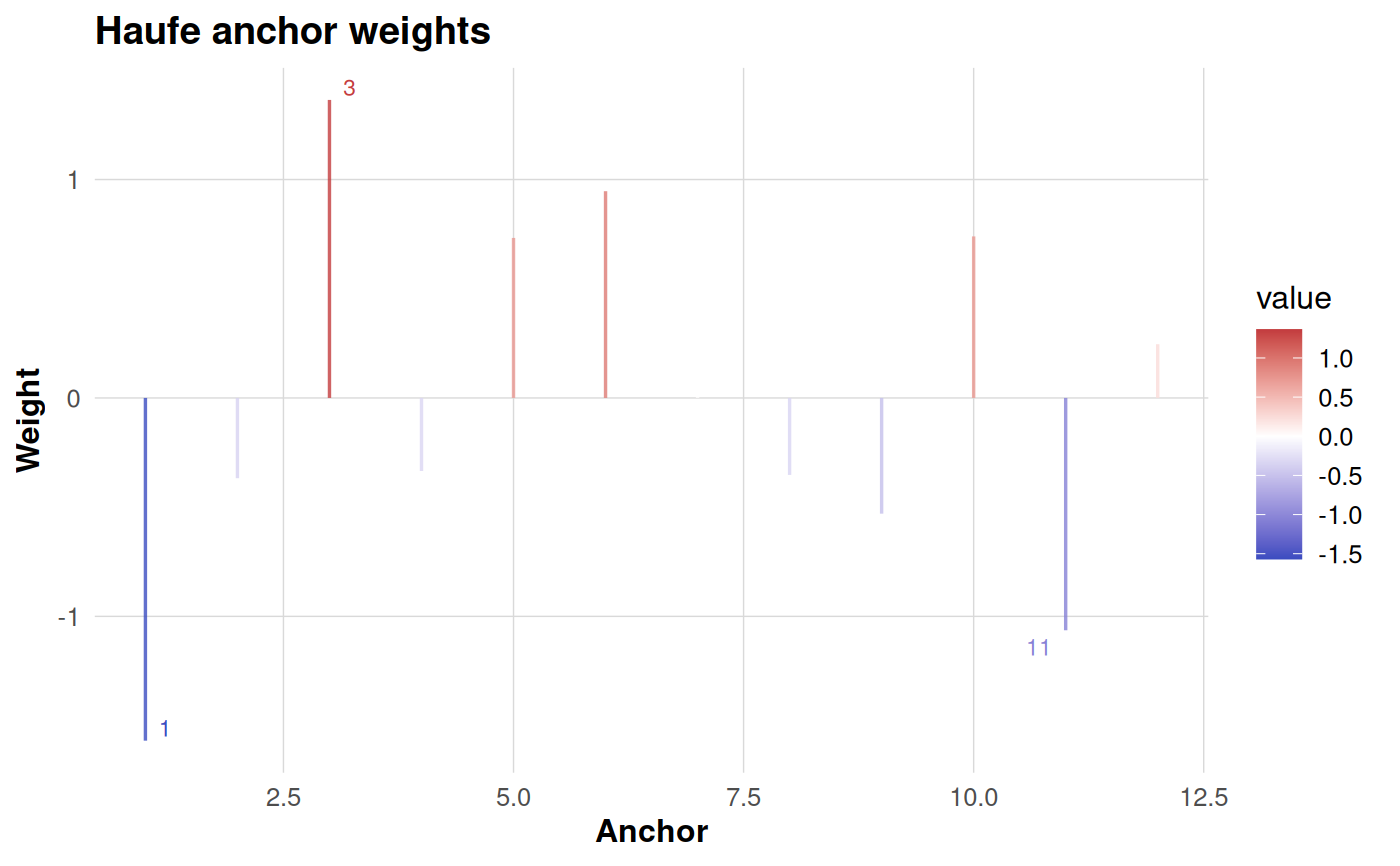
info_haufe <- list(mean_anchor = rnorm(12))
panels <- dkge_plot_info_anchor(info_haufe = info_haufe, top = 3)
panels$haufe