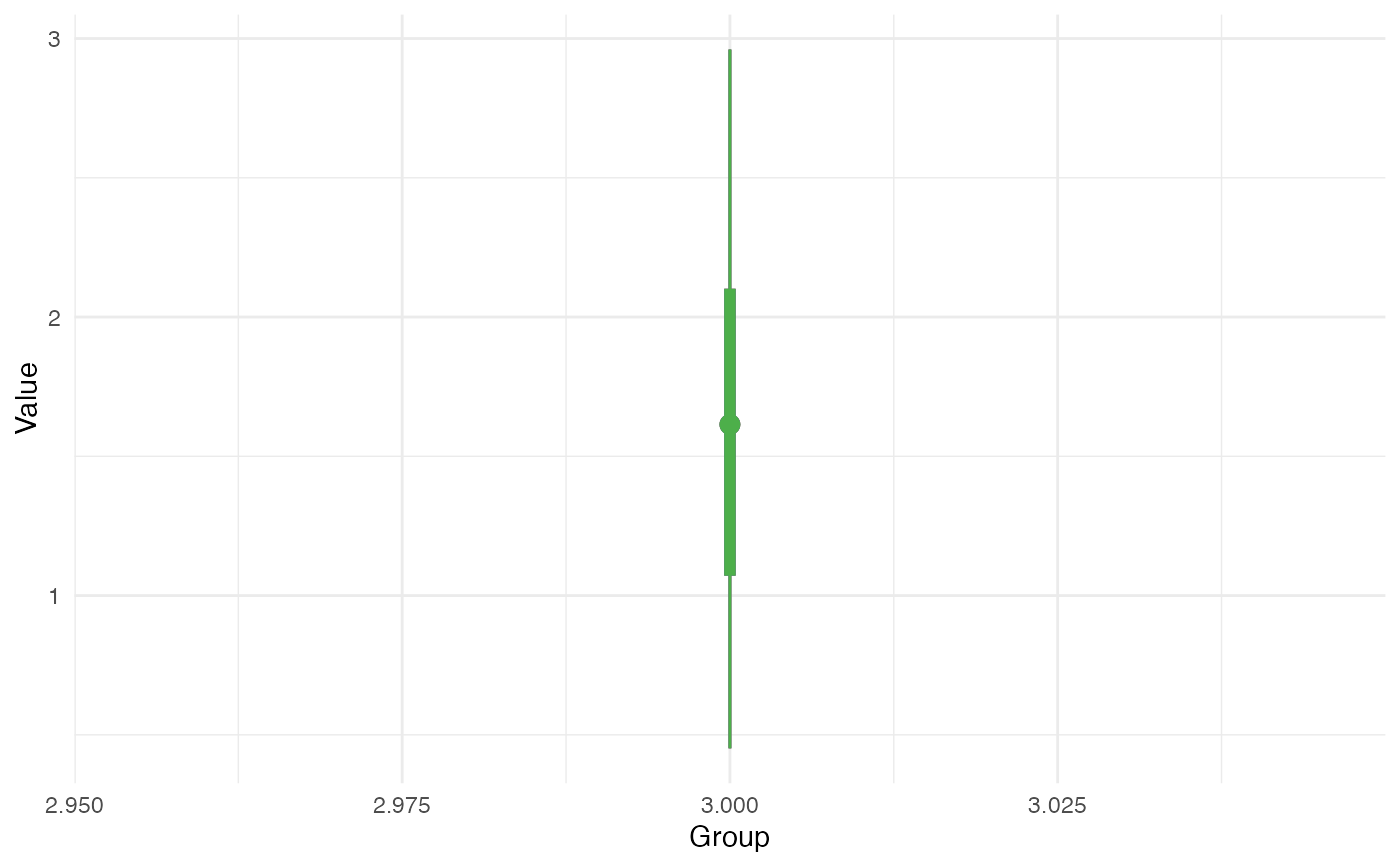
Creates narrow-form box plots showing quantile ranges (5th-95th percentile as
thin line, 25th-75th as thick line, median as point). Port of MATLAB
simplebox. For groups with fewer than 4 observations, individual points
are shown instead.
Usage
plot_simplebox(labels, data, colors = NULL)
Arguments
- labels
numeric or factor vector of group labels.
- data
numeric vector of data values (same length as labels).
- colors
optional matrix of RGB colors (one row per unique label), or a
single color vector applied to all groups. Values should be 0-1 scale.
If NULL, uses a default blue palette.
Value
ggplot object. Also returns (invisibly) a vector of median values per group.
Examples
set.seed(1)
labels <- rep(1:3, each = 20)
data <- rnorm(60) + labels * 0.5
plot_simplebox(labels, data)