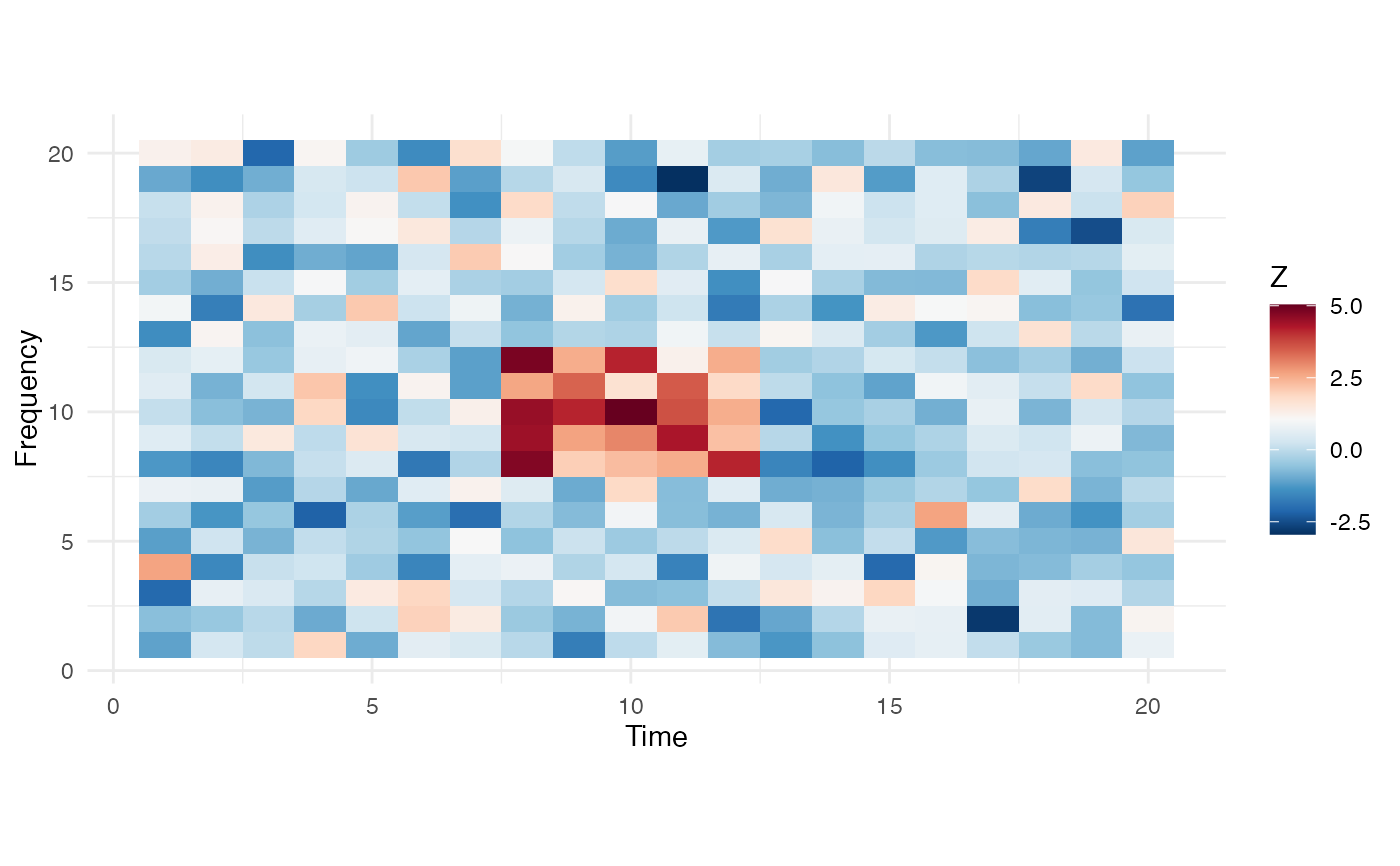
Visualize detected clusters as a heatmap with optional cluster boundary overlays.
Usage
plot_cluster_heatmap(
  data,
  clusters = NULL,
  freq_axis = NULL,
  time_axis = NULL,
  zlim = NULL,
  palette = "RdBu"
)
Arguments
- data
matrix of values (e.g., Z-scores).
- clusters
optional list of cluster objects from
detect_clusters.- freq_axis
optional frequency axis for y-axis labels.
- time_axis
optional time axis for x-axis labels.
- zlim
optional length-2 vector for color scale limits.
- palette
color palette name (default "RdBu").