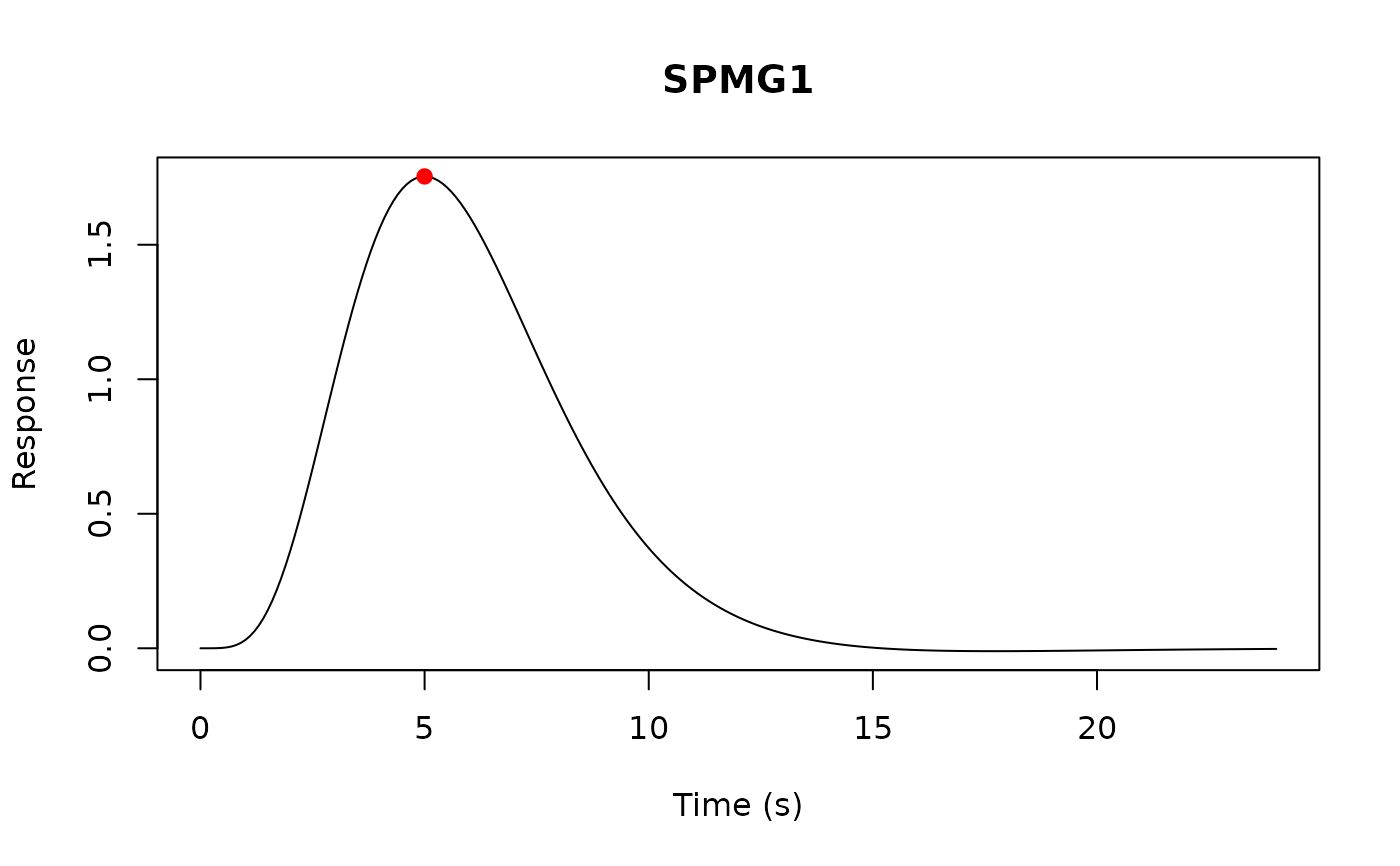
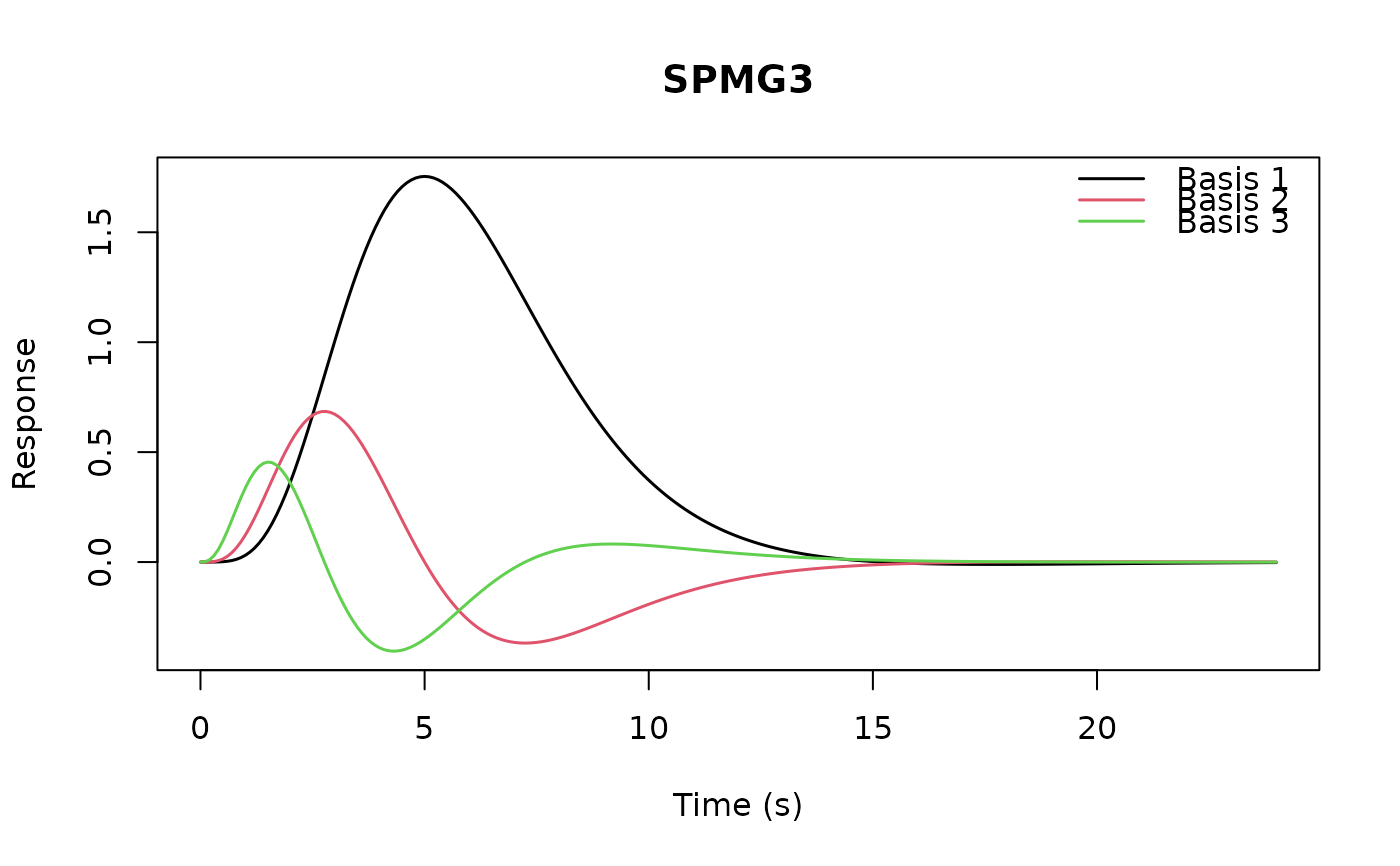
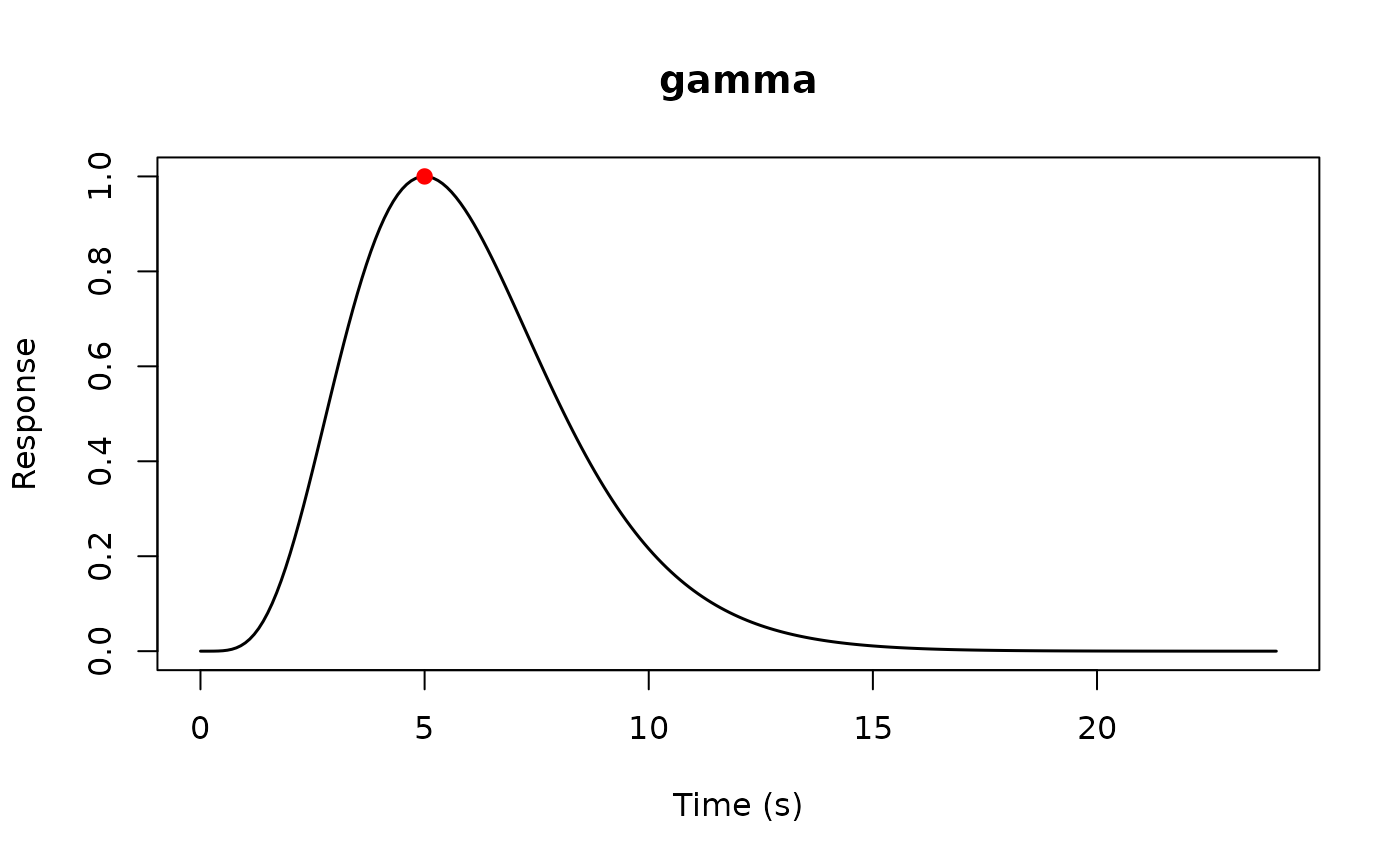
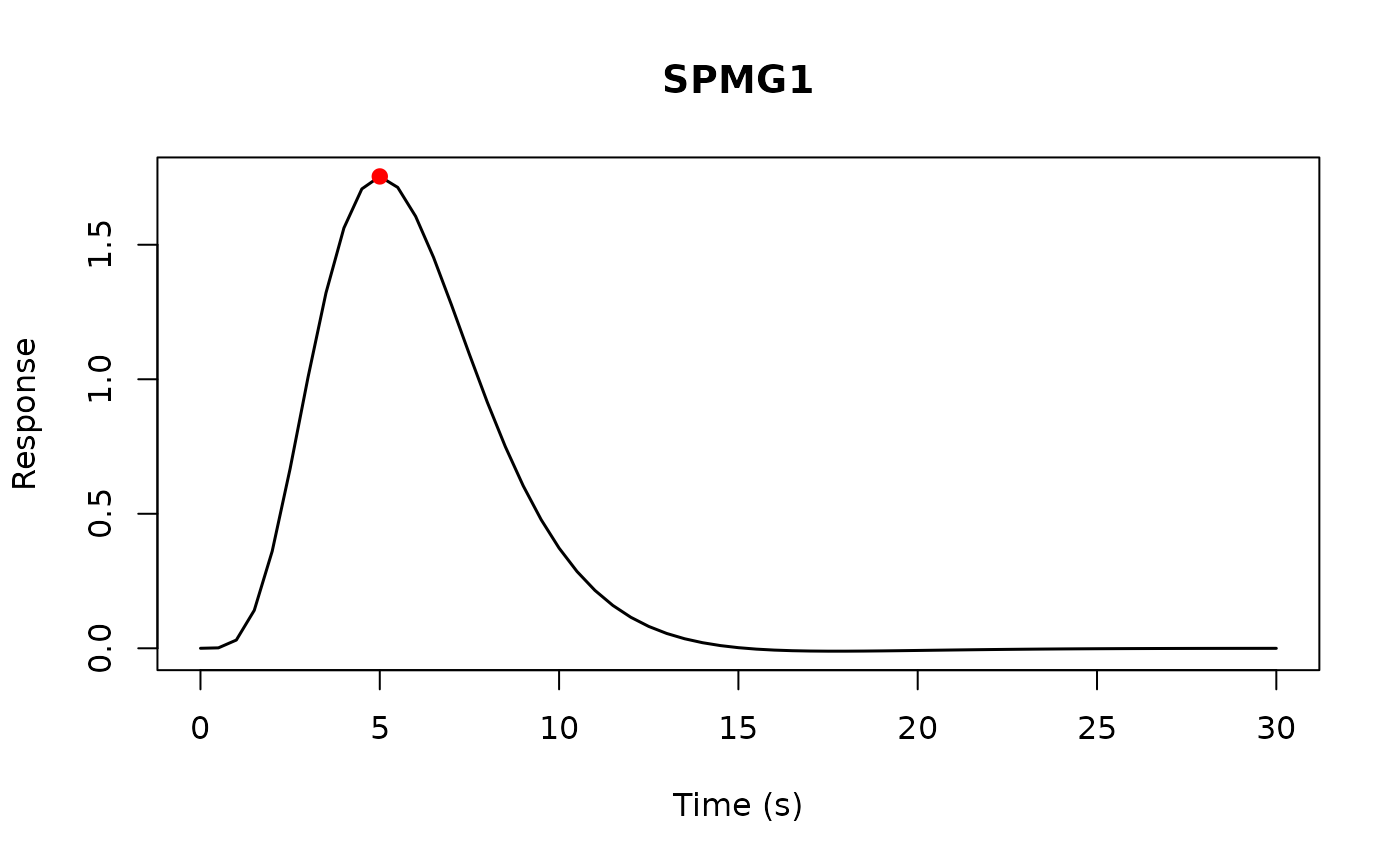
Creates a visualization of an HRF object. For single-basis HRFs, shows the response curve with peak annotation. For multi-basis HRFs (e.g., HRF_SPMG3), shows all basis functions on the same plot.
Usage
# S3 method for class 'HRF'
plot(x, time = NULL, normalize = FALSE, show_peak = TRUE, ...)
Arguments
- x
An HRF object
- time
Numeric vector of time points. If NULL (default), uses seq(0, span, by = 0.1) where span is the HRF's span attribute.
- normalize
Logical; if TRUE, normalize responses to peak at 1. Default is FALSE.
- show_peak
Logical; if TRUE (default for single-basis HRFs), annotate the peak time and amplitude on the plot.
- ...
Additional arguments passed to underlying plot functions.