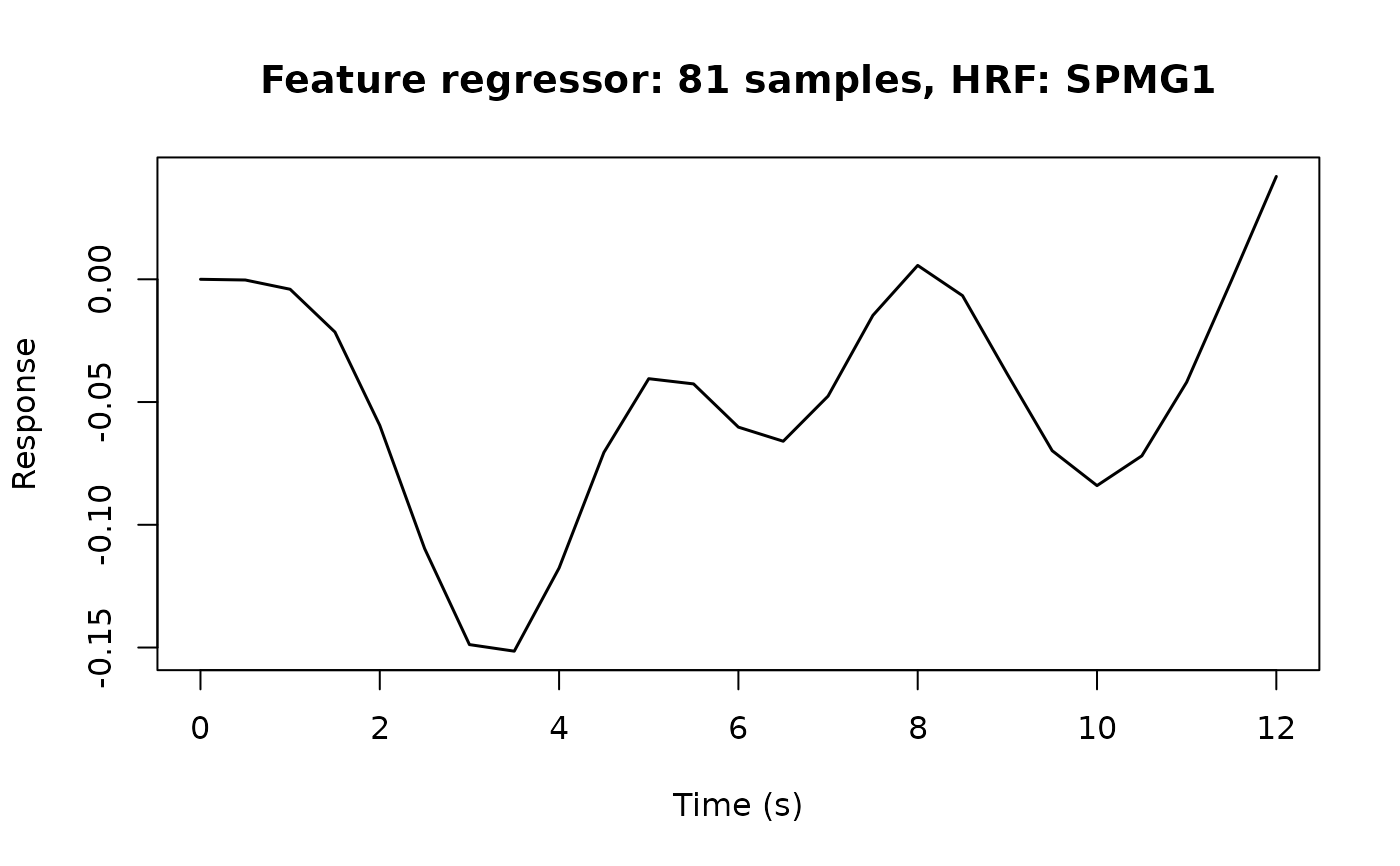
Plot a Feature Regressor
Arguments
- x
A
FeatureRegobject created byfeature_regressor().- grid
Numeric vector of time points for evaluation. If
NULL(default), a grid from 0 to max(times) + span with step 0.25 s is used.- show_onsets
Logical; if
TRUE, mark sample times with ticks on the time axis. Defaults toFALSEbecause a dense feature has one sample per bin.- onset_color
Colour for sample-time ticks. If NULL (default), a neutral grey.
- onset_alpha
Alpha transparency for sample-time ticks. Default is 0.5.
- precision
Numeric sampling precision for HRF evaluation. If NULL (default), the grid spacing capped at 0.33 s.
- layout
For multi-basis HRFs,
"stack"(default) or"overlay".- ...
Additional arguments passed to the underlying plot functions.