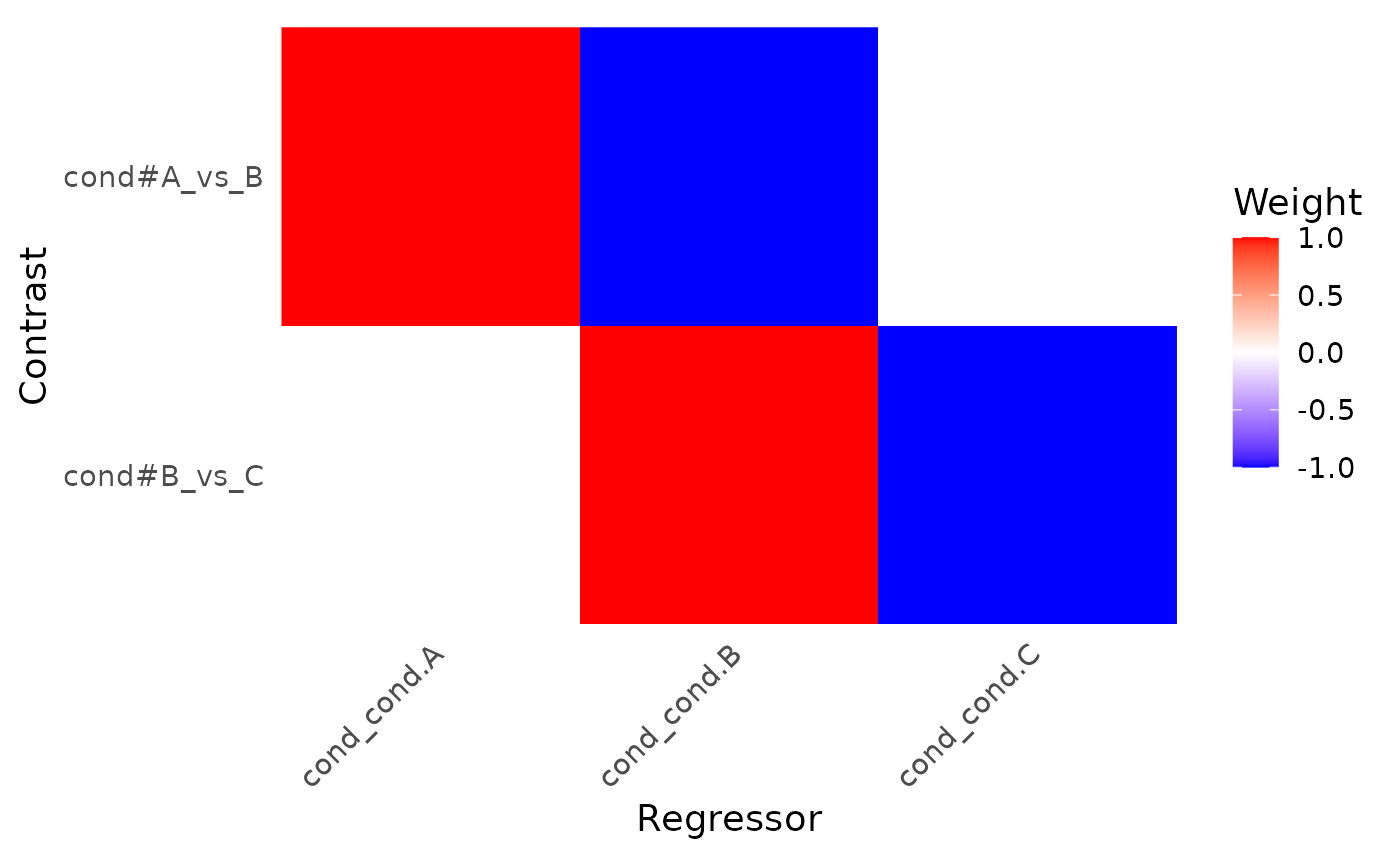
Produces a heatmap of all contrasts defined for an event_model.
Rows = each contrast (or column of an F-contrast), columns = each regressor in
the full design matrix, and the fill color = the contrast weight.
Usage
# S3 method for class 'event_model'
plot_contrasts(
  x,
  absolute_limits = FALSE,
  rotate_x_text = TRUE,
  scale_mode = c("auto", "diverging", "one_sided"),
  coord_fixed = TRUE,
  ...
)
Arguments
- x
An
event_modelwith (lazily) defined contrasts.- absolute_limits
Logical; if
TRUE, the color scale is fixed at (-1,1). IfFALSE, the range is set to (min, max) of the weights.- rotate_x_text
Logical; if
TRUE, rotate x-axis labels for readability.- scale_mode
Character; 'auto', 'diverging', or 'one_sided' color scaling.
- coord_fixed
Logical; if TRUE, use fixed aspect ratio.
- ...
Further arguments passed to
geom_tile, e.g.color="grey80".
Examples
# Create event model with contrasts
des <- data.frame(
  onset = c(0, 10, 20, 30, 40, 50),
  run = 1,
  cond = factor(c("A", "B", "C", "A", "B", "C"))
)
sframe <- fmrihrf::sampling_frame(blocklens = 60, TR = 1)
cset <- contrast_set(
  A_vs_B = pair_contrast(~ cond == "A", ~ cond == "B", name = "A_vs_B"),
  B_vs_C = pair_contrast(~ cond == "B", ~ cond == "C", name = "B_vs_C")
)
emod <- event_model(onset ~ hrf(cond, contrasts = cset),
                    data = des, block = ~run, sampling_frame = sframe)
plot_contrasts(emod)