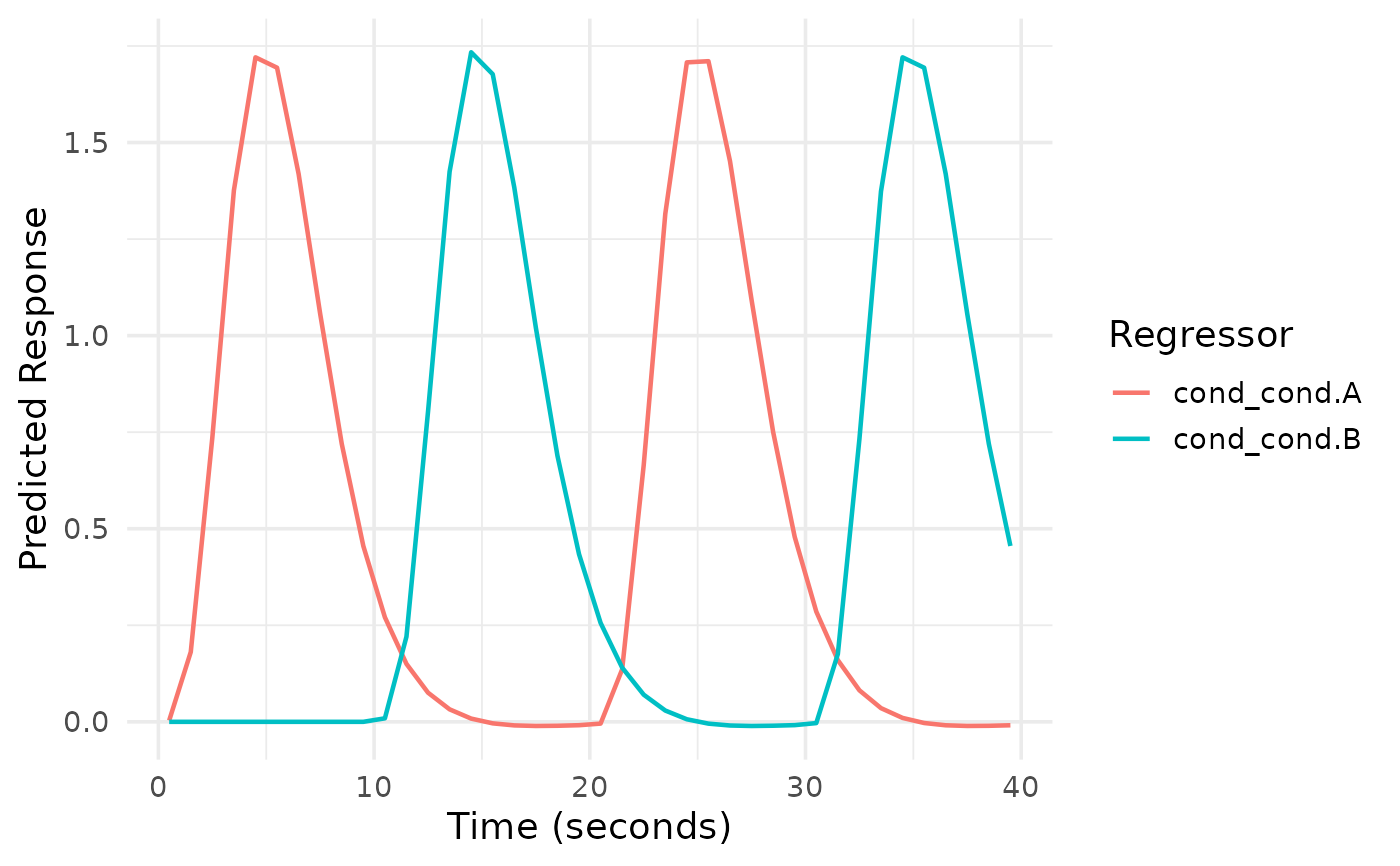
Creates a line plot visualization of the predicted BOLD response for each regressor in an event_model object.
Arguments
- x
An
event_modelobject.- term_name
Character. Name of specific term to plot. If NULL, plots all terms.
- facet_threshold
Integer. Switch to faceting when number of regressors exceeds this value. Default 6.
- label_mode
Character. One of
"auto","compact","none". In"auto"mode the method abbreviates labels for moderate counts and suppresses labels entirely when they are excessive (>max_labels)."compact"always abbreviates labels."none"suppresses legend and facet strip labels.- max_labels
Integer. When
label_mode = "auto"and the number of regressors exceeds this value, labels are suppressed. Default 30.- abbrev_min
Integer. Minimum length used by
base::abbreviate()when compacting labels. Default 10.- strip_text_size
Numeric. Strip label text size when faceting with labels. Default 8.
- block_x
Time axis to use for multi-run designs.
"global"(default) uses concatenated time so each block occupies a distinct x-range;"run"uses run-relative time that restarts each block. In either case line segments are grouped by block so a regressor is never connected across a run boundary (this is what prevents the spurious high-frequency oscillations that appear when all blocks share one block-relative axis).- facet_by_block
Logical; if
TRUE, draw one panel per block. Defaults toFALSE. Useful for multi-run designs where overlaid runs are cluttered.- show_block_bounds
Logical; if
TRUE(default), draw dashed vertical rules at each run's start/end (blocklen * TR). These make late starts and overruns obvious and complement theevent_model()onset bounds check. Drawn only when asampling_frameis available.- ...
Additional arguments (currently unused).
Details
This method attempts to keep labels readable when there are many
regressors (e.g., trial-wise designs) by switching to faceting and either
abbreviating or suppressing labels depending on thresholds. You can control
this behavior via label_mode, max_labels, and abbrev_min.
Examples
# Create a simple event model
des <- data.frame(
  onset = c(0, 10, 20, 30),
  run = 1,
  cond = factor(c("A", "B", "A", "B"))
)
sframe <- fmrihrf::sampling_frame(blocklens = 40, TR = 1)
emod <- event_model(onset ~ hrf(cond), data = des, block = ~run, sampling_frame = sframe)

# Plot all regressors
plot(emod)


# Plot specific term only
plot(emod, term_name = "cond")
# Plot specific term only
plot(emod, term_name = "cond")
