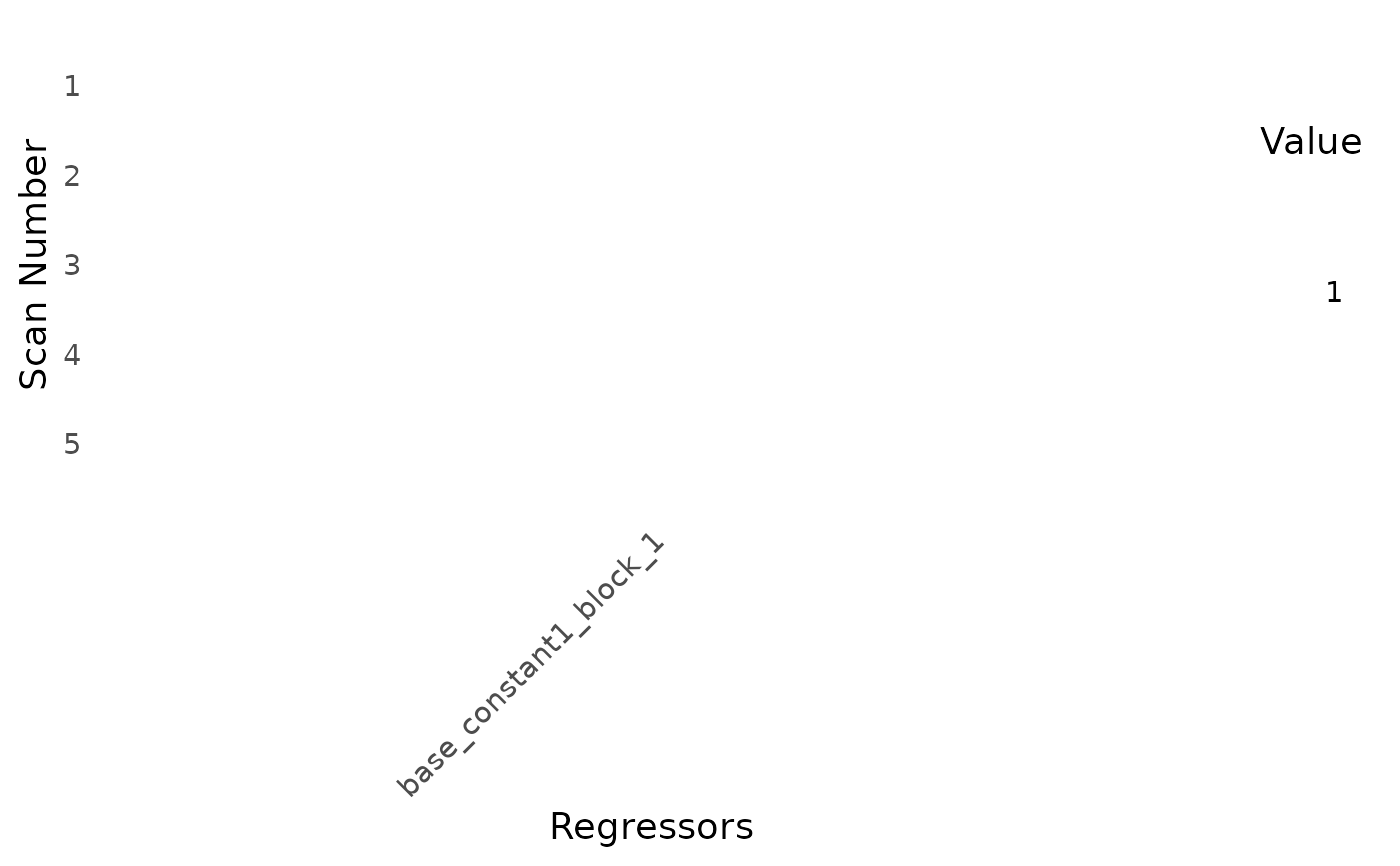
Heatmap visualization of the baseline_model design matrix
Source:R/baseline_model.R
design_map.baseline_model.RdProduces a heatmap of all columns in the design matrix for a baseline_model object,
with rows corresponding to scans and columns corresponding to regressors. By default,
it draws horizontal lines separating runs (blocks), and rotates the column labels diagonally.
Usage
# S3 method for class 'baseline_model'
design_map(
  x,
  block_separators = TRUE,
  rotate_x_text = TRUE,
  fill_midpoint = NULL,
  fill_limits = NULL,
  ...
)
Arguments
- x
A
baseline_modelobject.- block_separators
Logical; if
TRUE, draw white horizontal lines between blocks.- rotate_x_text
Logical; if
TRUE, rotate x-axis labels by 45 degrees.- fill_midpoint
Numeric or
NULL; if notNULL, used as themidpointinggplot2::scale_fill_gradient2()to center the color scale (for example at 0).- fill_limits
Numeric vector of length 2 or
NULL; passed to the fill scalelimitsargument. Can clip or expand the color range.- ...
Additional arguments forwarded to
ggplot2::geom_tile().
Examples
sframe <- fmrihrf::sampling_frame(blocklens = 5, TR = 1)
bmod <- baseline_model(sframe = sframe)
if (requireNamespace("ggplot2", quietly = TRUE)) design_map(bmod)