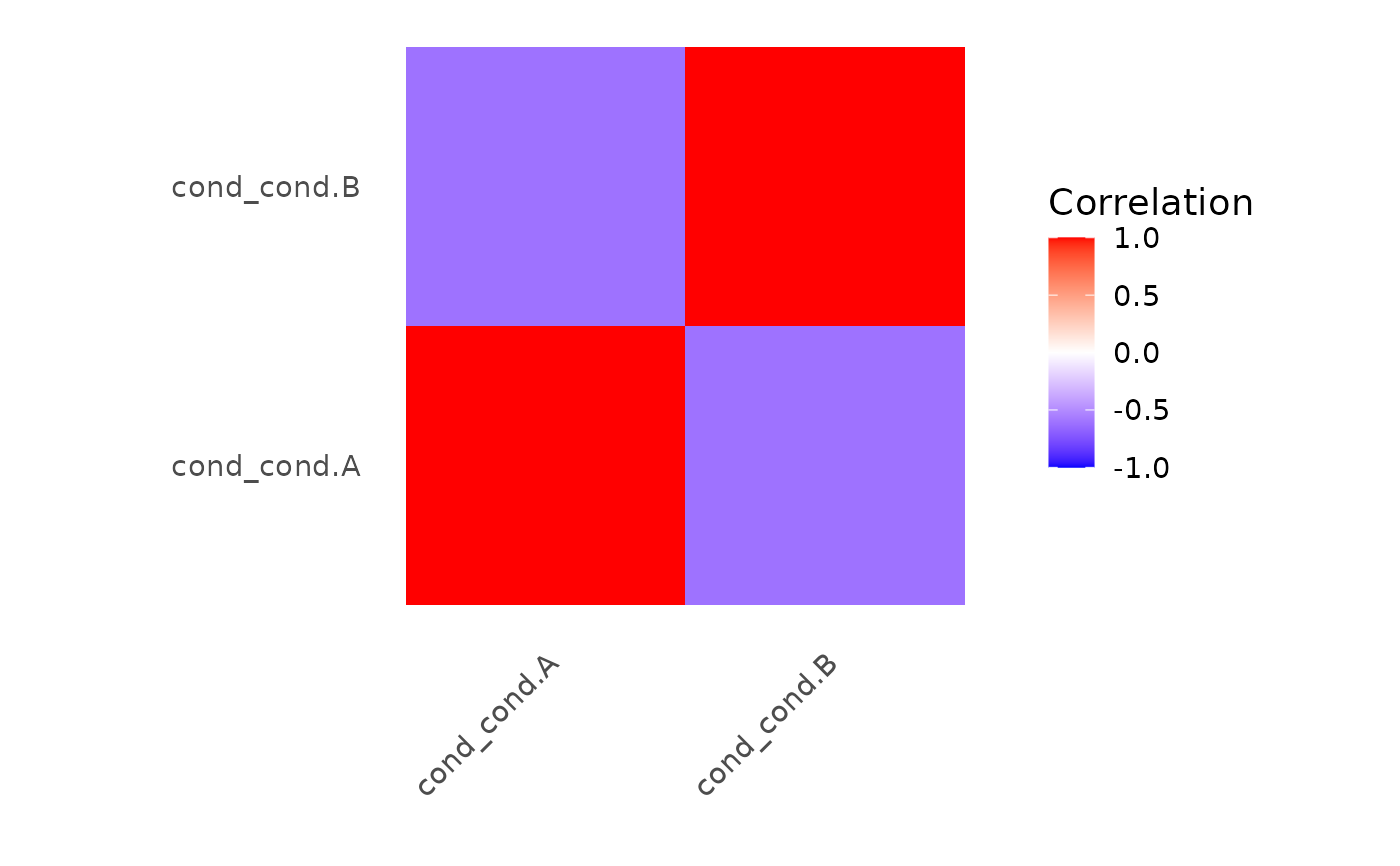
Creates a heatmap visualization of the correlation matrix between regressors in an event_model object.
Usage
# S3 method for class 'event_model'
correlation_map(x, rotate_x_text = TRUE, ...)Examples
des <- data.frame(
  onset = c(0, 10, 20, 30),
  run = 1,
  cond = factor(c("A", "B", "A", "B"))
)
sframe <- fmrihrf::sampling_frame(blocklens = 40, TR = 1)
emod <- event_model(onset ~ hrf(cond), data = des, block = ~run, sampling_frame = sframe)
correlation_map(emod)