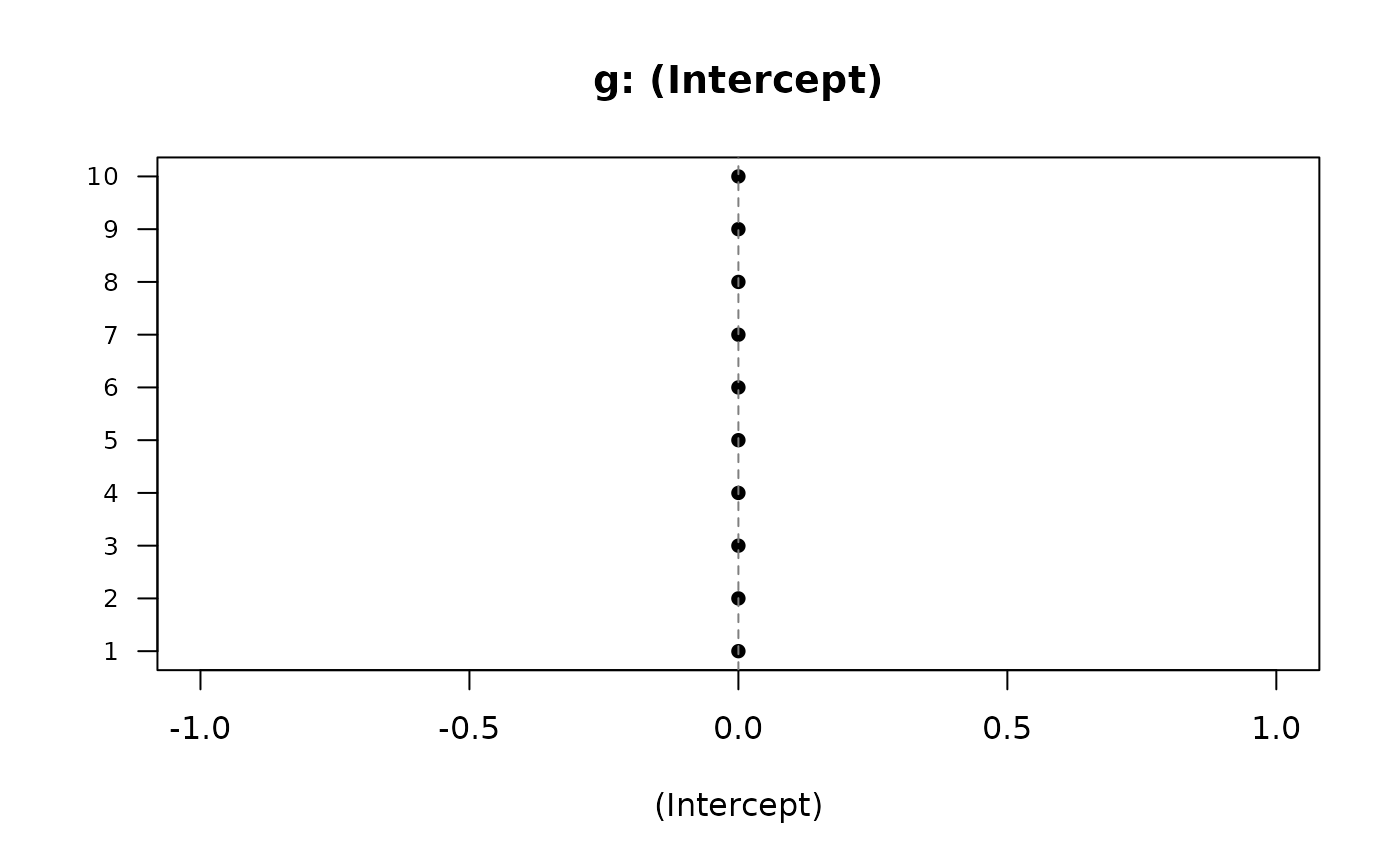
plot() on the result of ranef() draws a caterpillar plot (dot chart)
of the conditional modes for each grouping factor and coefficient, with
levels sorted by their value and, when the object carries conditional
variances (ranef(fit, condVar = TRUE)), level prediction intervals,
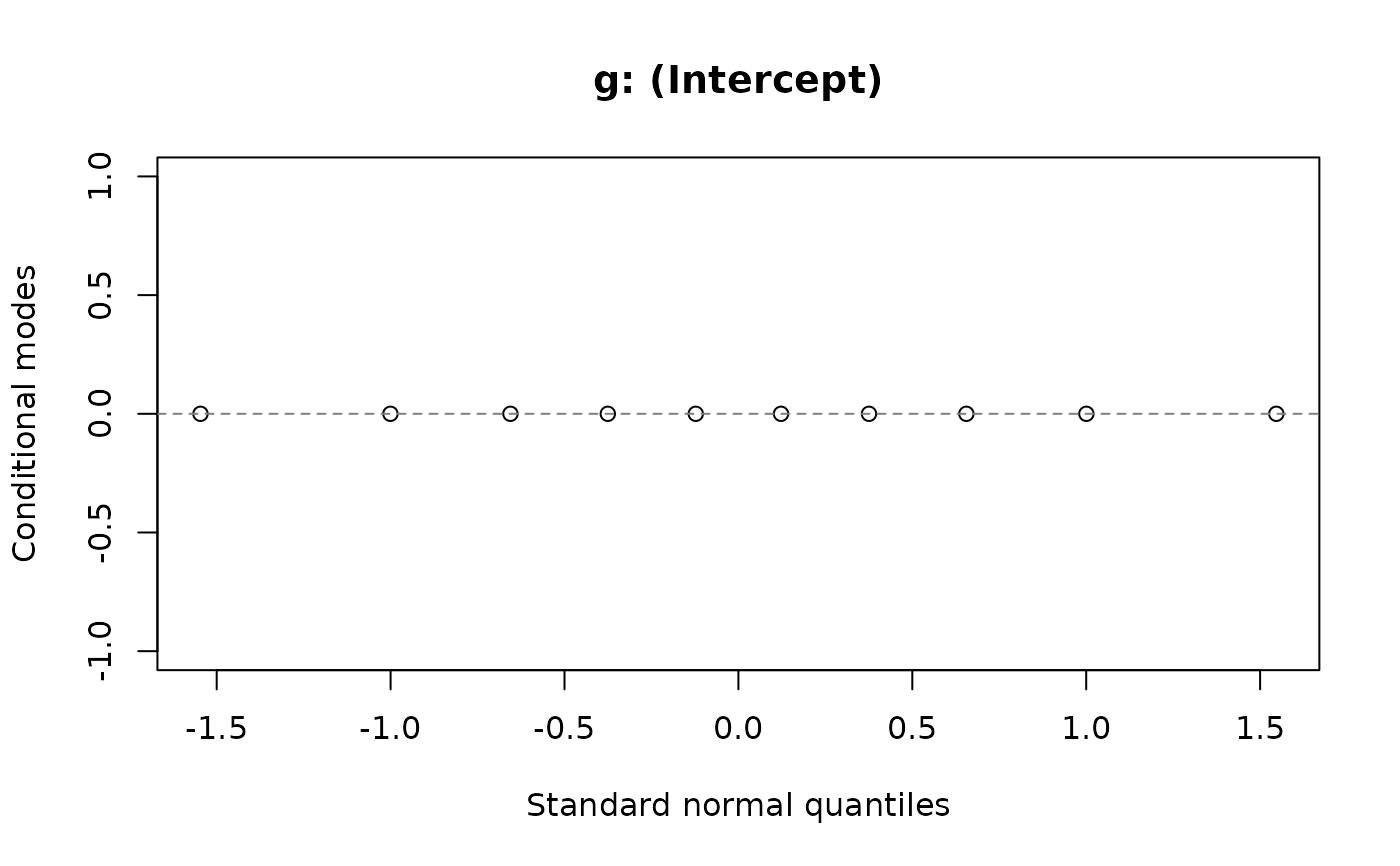
mirroring lattice::dotplot() on lme4's ranef() output. qqnorm()
draws normal Q-Q plots of the conditional modes, one panel per grouping
factor and coefficient.
Arguments
- x, y
An
mm_ranefobject fromranef().- level
Coverage of the intervals (default 0.95).
- type
"caterpillar"(default) or"qq".- ...
Further graphical parameters passed to
graphics::plot().
Details
When the lattice package is loaded, lattice::dotplot() and
lattice::qqmath() also work on ranef() output and return one trellis
object per grouping factor, as they do for lme4.
Intervals are omitted for coefficients whose conditional variances are not
available (for example GLMM fits where ranef(condVar = TRUE) returns
NA variances).