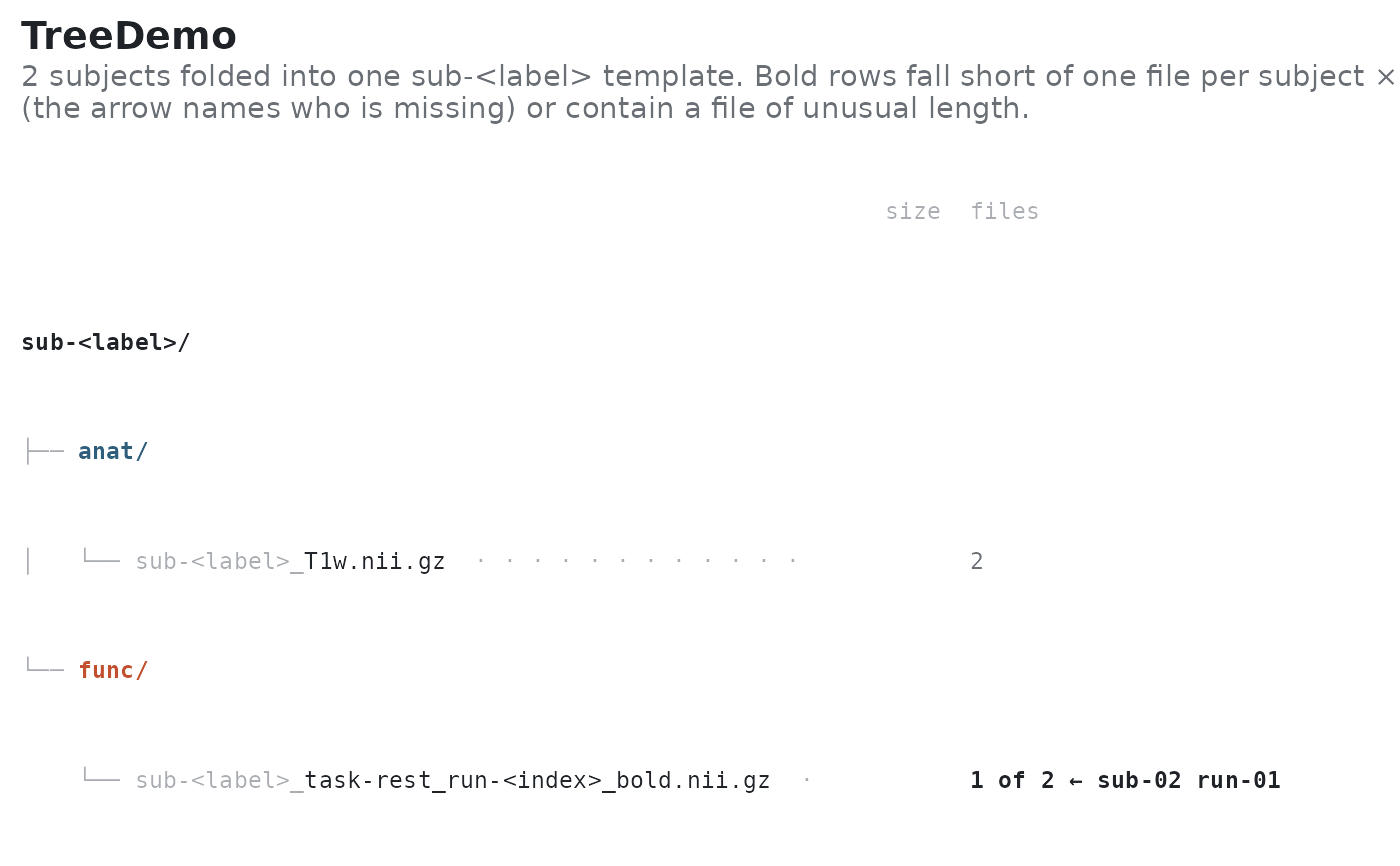
Plot the file layout of a BIDS project as a template tree
Source:R/plot_bids_matrix.R
plot_bids_tree.RdCollapses every subject (and session) into a single sub-<label> template
so the dataset's shape fits on one screen, then annotates each template
with how many subjects actually have it. Directories are drawn with their
datatype colour; files that some subjects lack are flagged.
Usage
plot_bids_tree(
  x,
  include_derivatives = TRUE,
  collapse_runs = TRUE,
  include_sidecars = TRUE,
  max_rows = 60,
  short_names = FALSE
)
Arguments
- x
A
bids_projectormock_bids_project.- include_derivatives
Logical. Show
derivatives/pipelines.- collapse_runs
Logical. Fold
run-1,run-2, ... into a singlerun-<index>row.- include_sidecars
Logical. Show
.jsonsidecars.- max_rows
Maximum number of rows to draw before truncating.
- short_names
Logical. Replace the
sub-<label>_ses-<label>_prefix that every file name repeats with an ellipsis, for a narrower figure.
Value
A ggplot object. Because the layout is monospace text, its natural
size is known: attr(p, "bidser_size") gives a suggested width and
height in inches for ggsave() or knitr's fig.width/fig.height.
Examples
fs <- tibble::tribble(
  ~subid, ~session, ~datatype, ~task, ~run, ~suffix, ~fmriprep,
  "01", NA, "anat", NA, NA, "T1w.nii.gz", FALSE,
  "01", NA, "func", "rest", "01", "bold.nii.gz", FALSE,
  "02", NA, "anat", NA, NA, "T1w.nii.gz", FALSE
)
mock <- create_mock_bids("TreeDemo", c("01", "02"), fs)
if (requireNamespace("ggplot2", quietly = TRUE)) {
  plot_bids_tree(mock)
}